A radar studio that looks like it belongs on air.
Live NEXRAD from any radar, the whole country in 240 products, the weather models, satellite, hurricanes, hazard outlooks and 3D, with storm cells that score and track themselves, drawn on a map you style, with a header, legend and storm list dressed like your broadcast. Built into AtmoDeck. Free data, no keys.
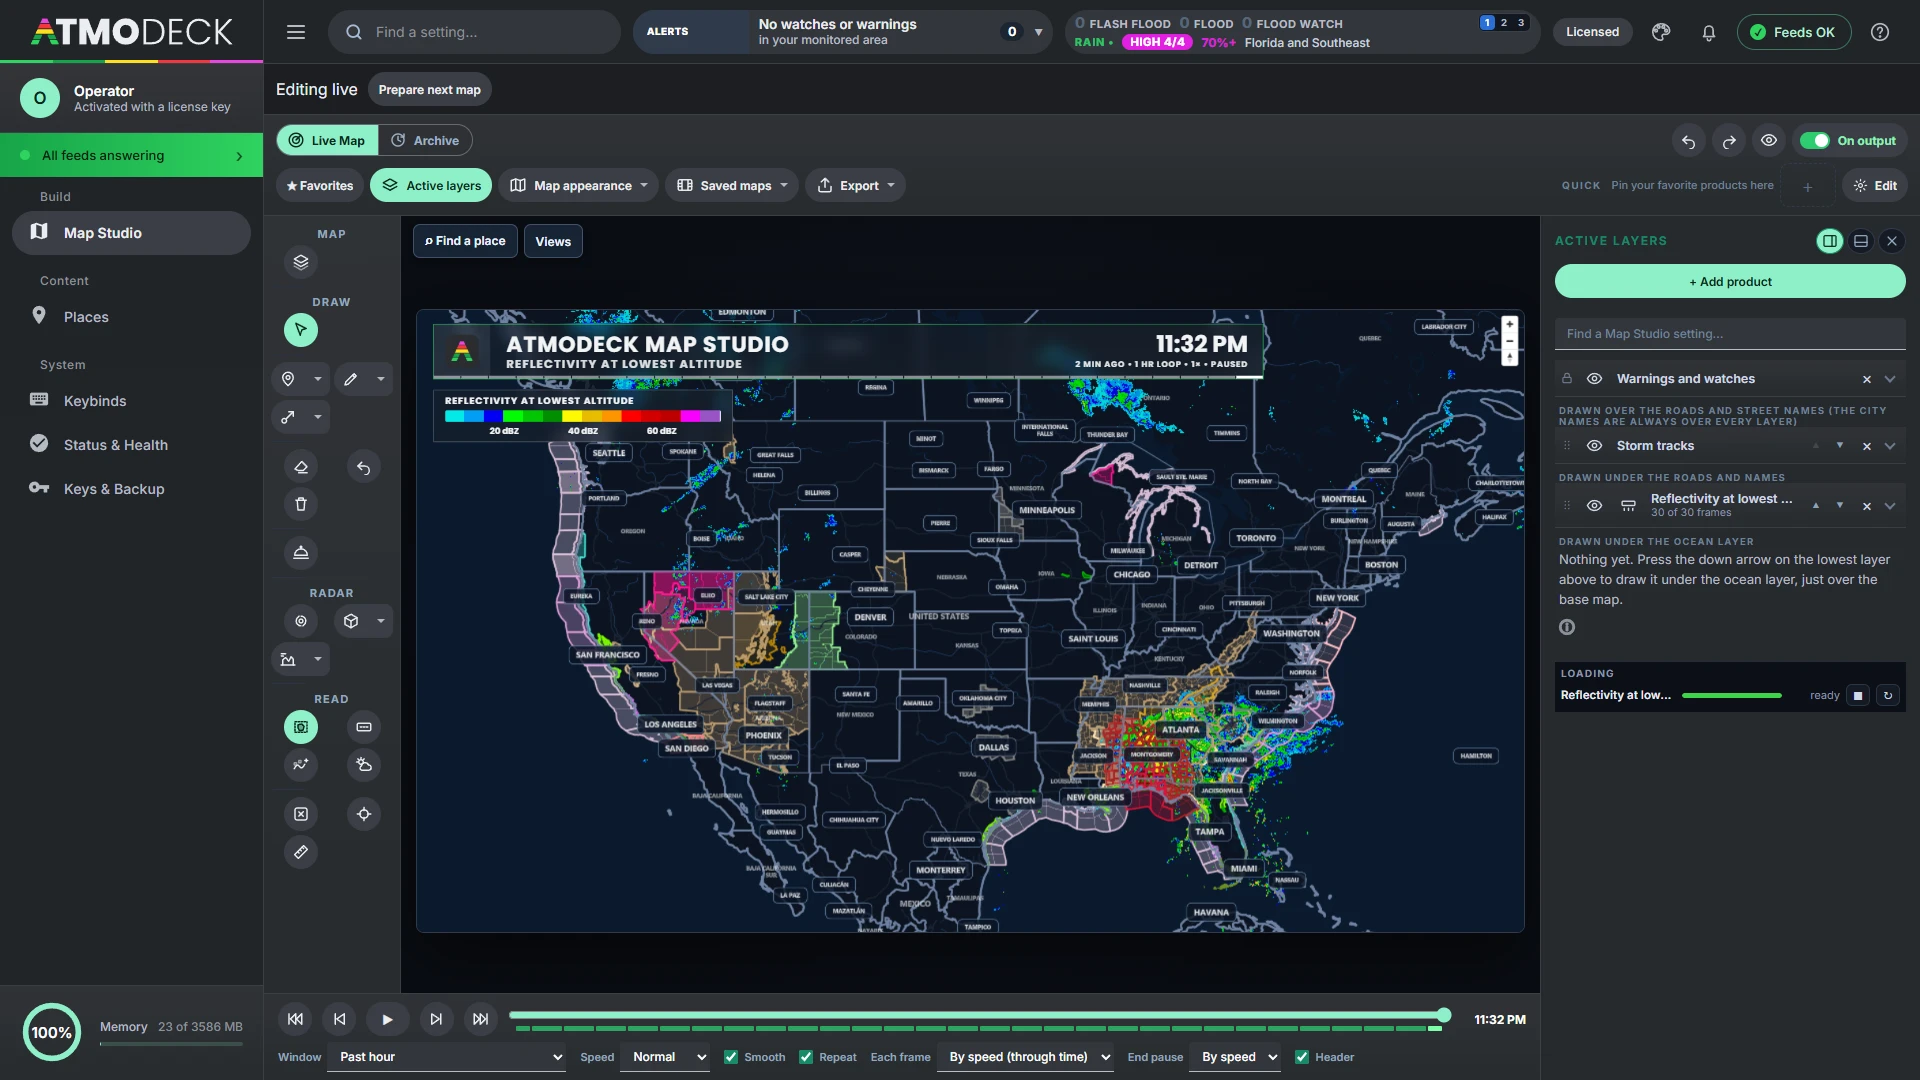
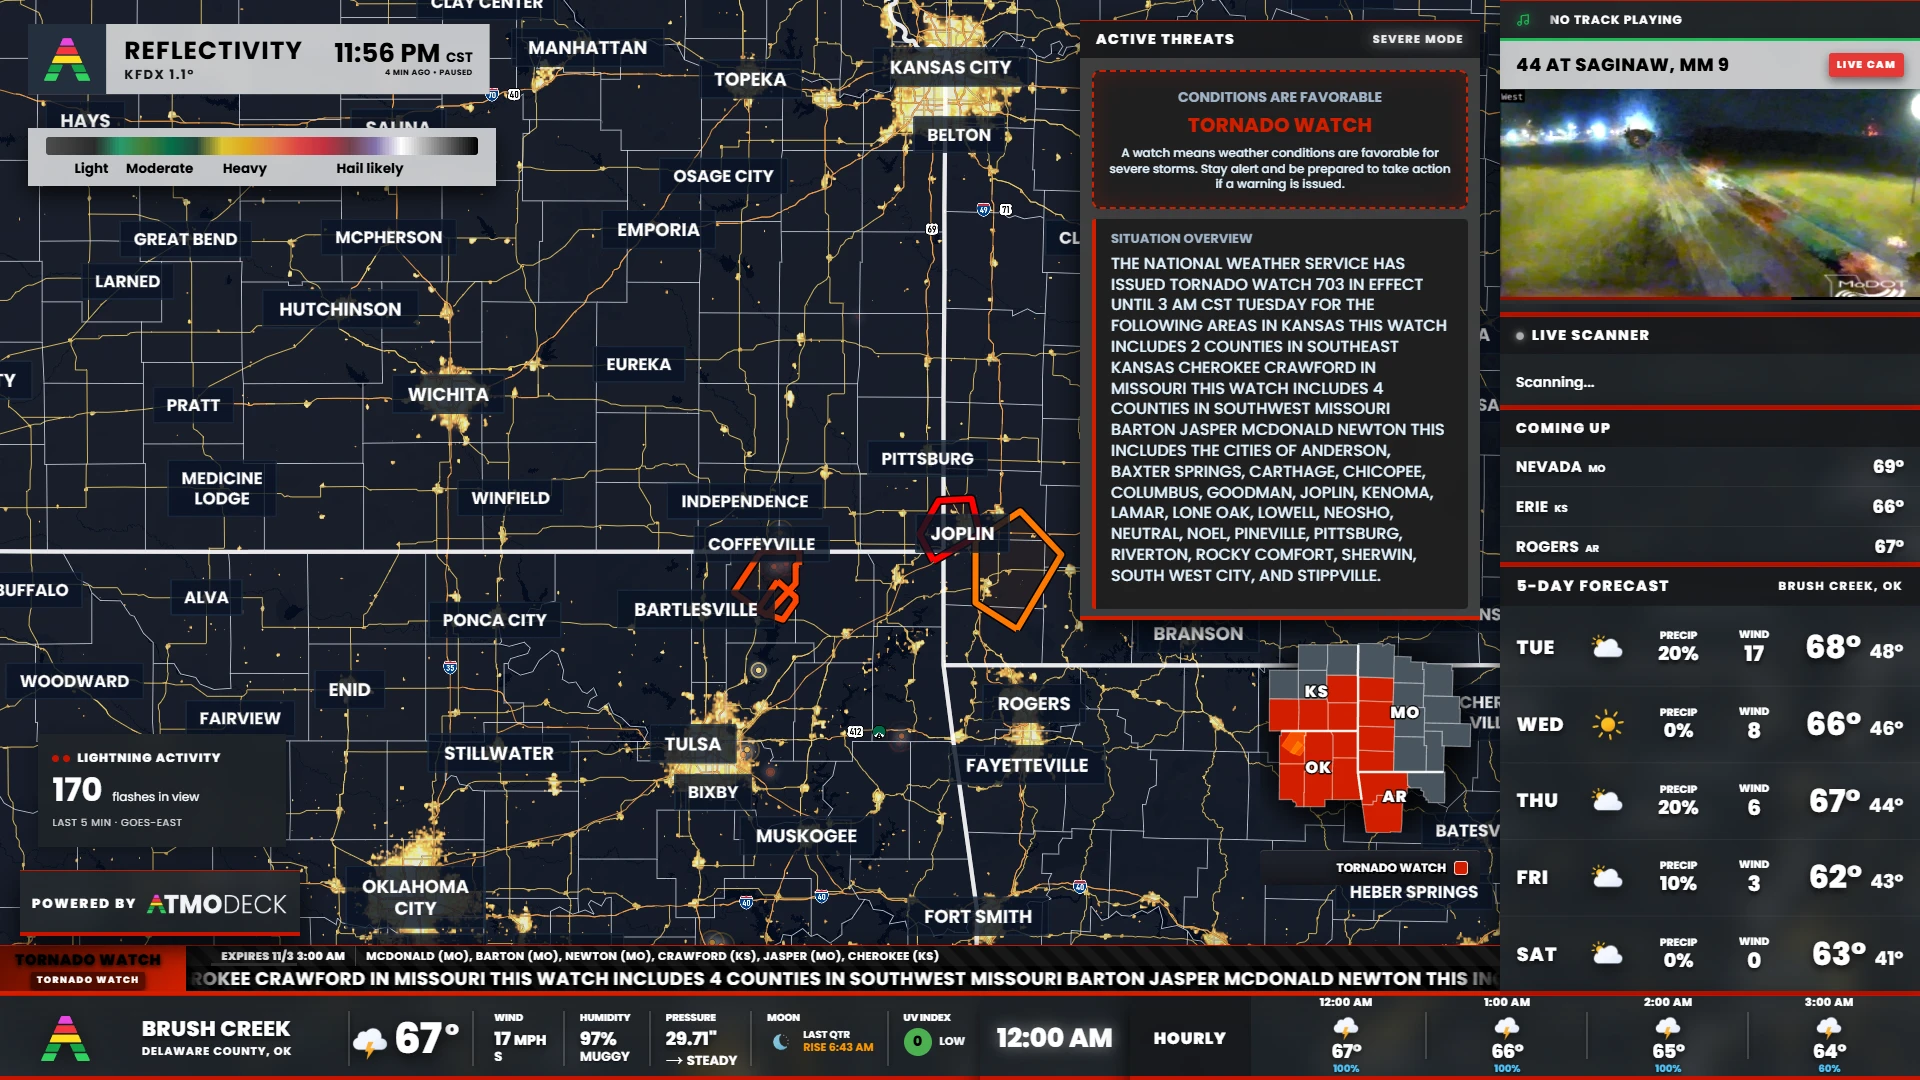
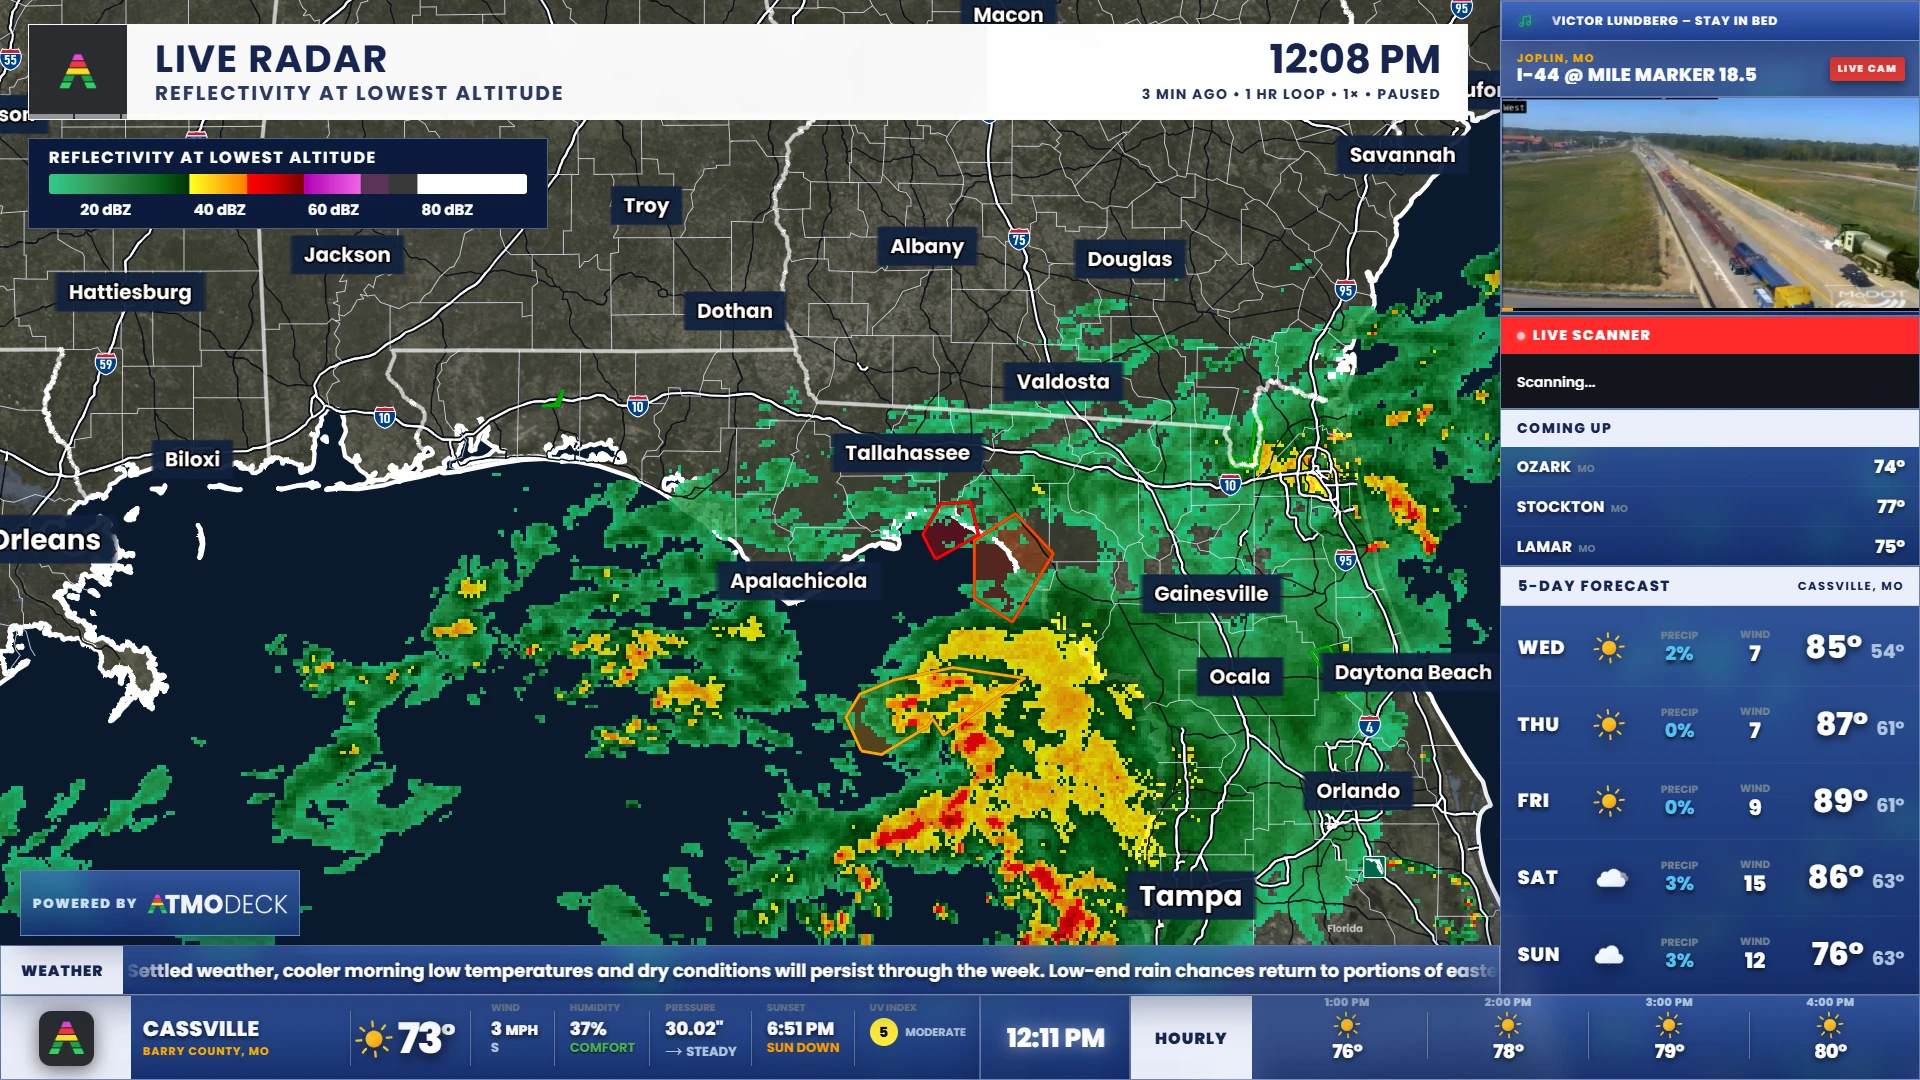
You steer in the Console. Viewers see the Output.
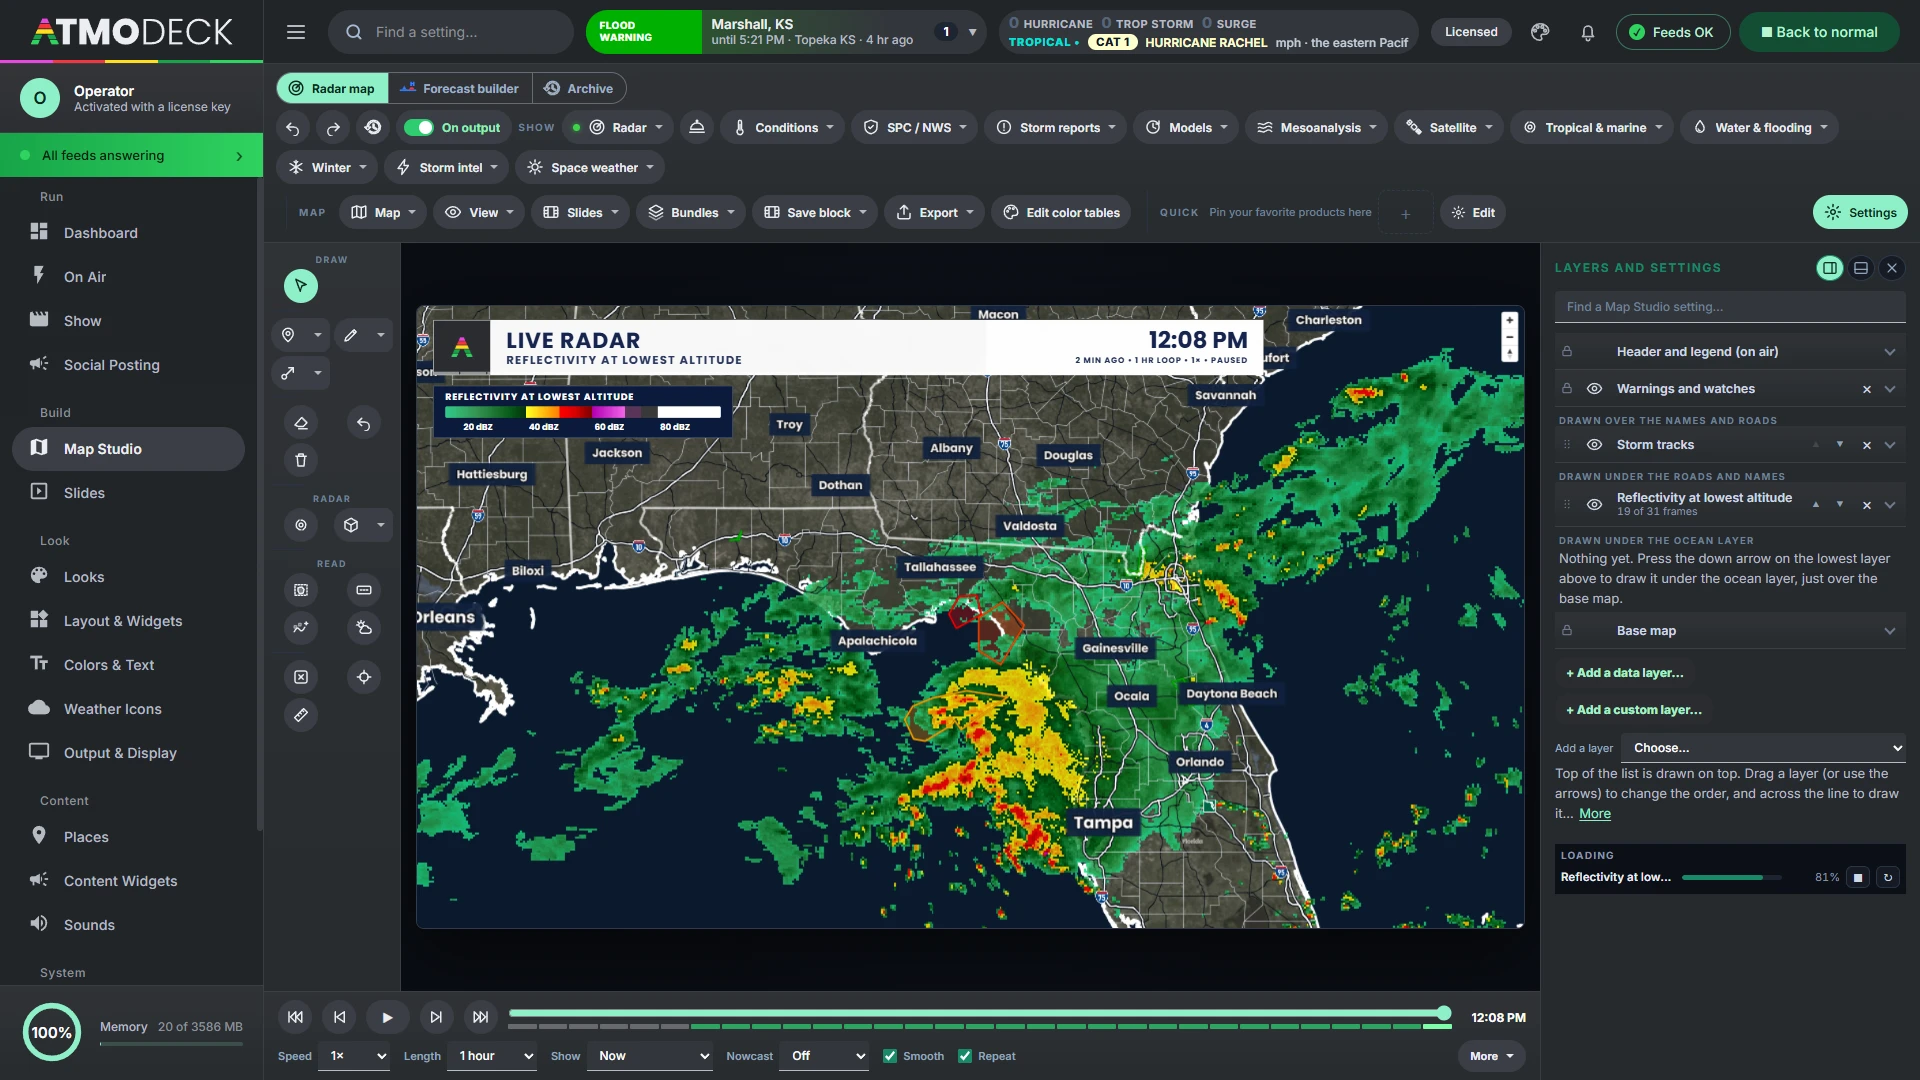
The map sits behind your widgets on the Output window and is run from the Map Studio page of the Console. Menus across the top follow the data: Radar (national, one radar or Canada, with its products, lightning and the storms) and its Tilt, Conditions, Outlook/Forecast, Models, Mesoanalysis, Satellite and Tropical & marine, then Map, View, Slides, Bundles, Export and Edit color tables. A tool rail beside the map holds drawing, 3D, the scope, cross sections, readings and a Clear all button.
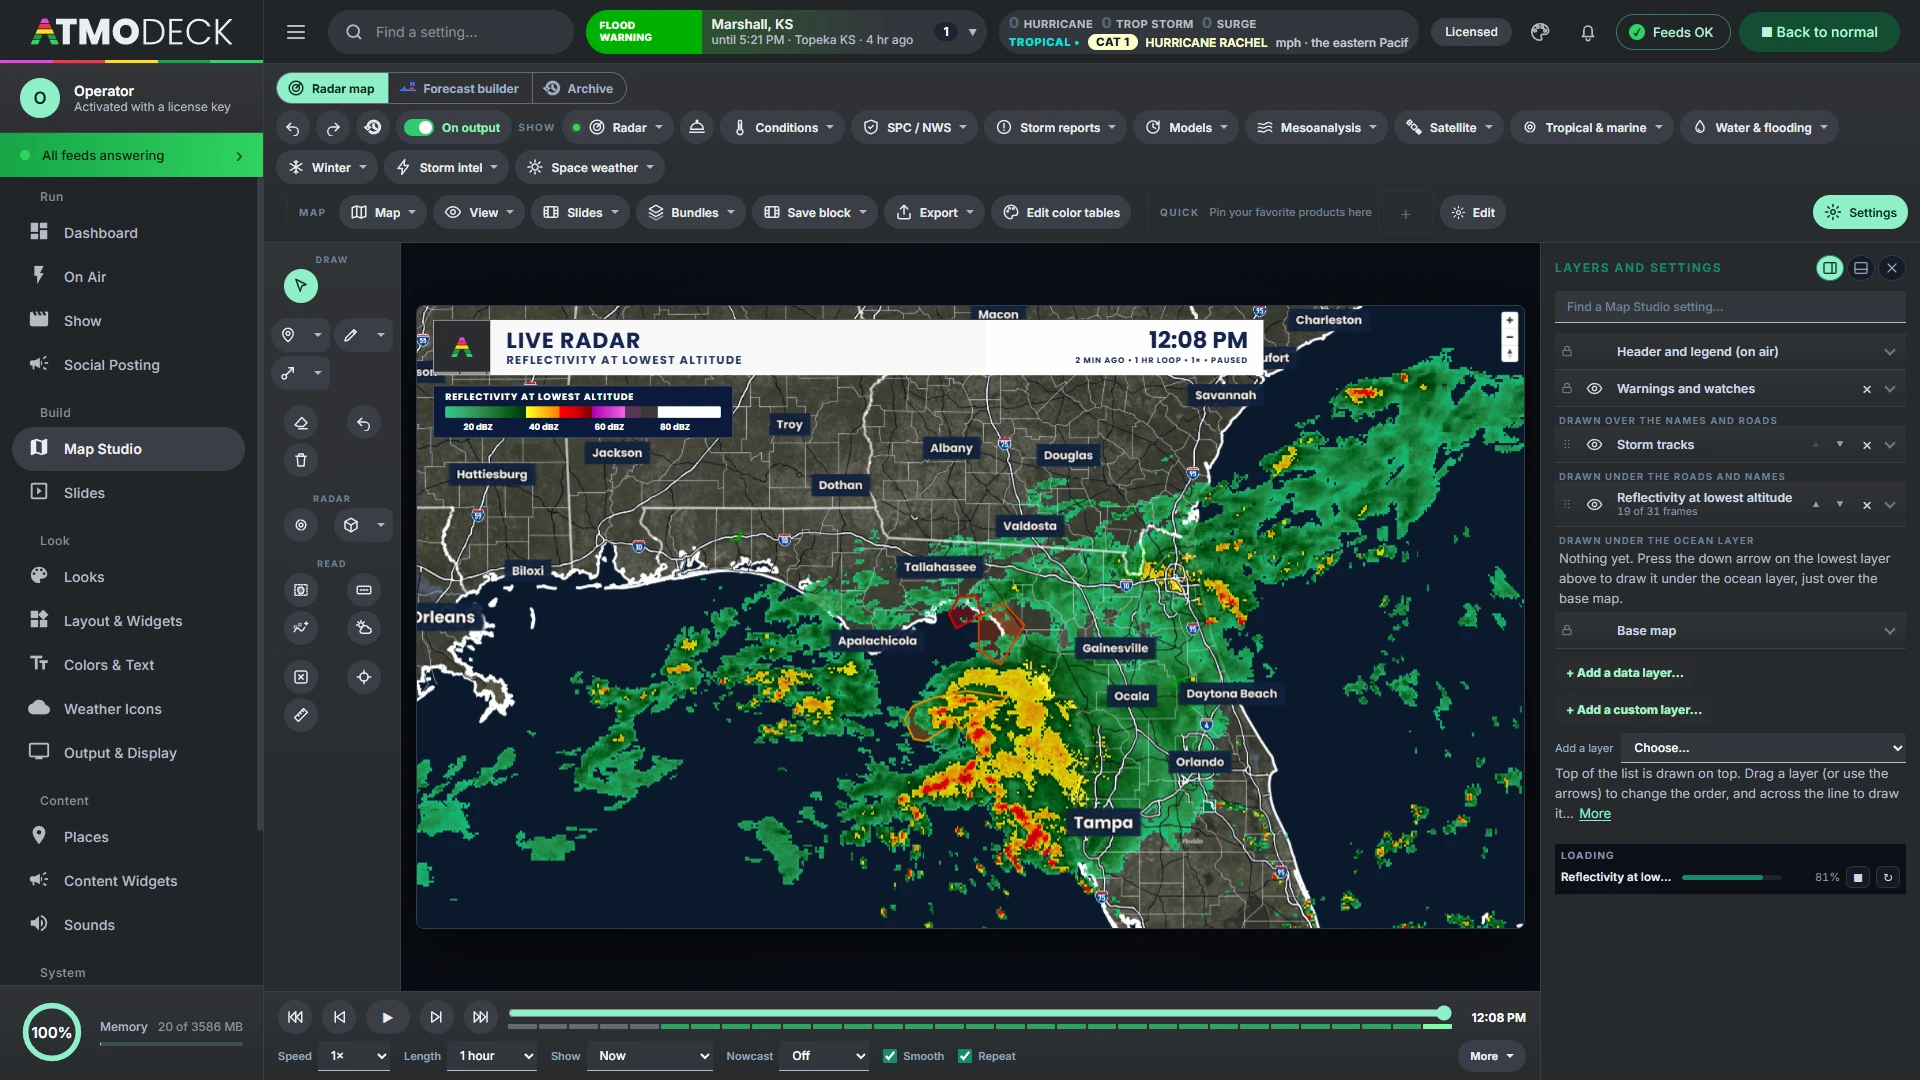
The Settings button opens one list of layers: everything on the map from top to bottom, each with an eye to hide it, a cross to take it off, arrows or a drag to reorder it, and a drop-down with every setting it has (its color table, smoothing, floor, lines and readings). The base map, the warnings, the storm tracks, the markers and the header and legend are rows in the same list. Under it, a loading box shows each product's progress with Stop and Restart.
Live or Explore. A switch beside the map’s modes chooses how the Console’s map reaches the air. In Live what you do on it is on the Output as you do it, with ON AIR and a red ring round the map. In Explore you work in private and press Send to output when it is ready; Output on / off takes the map off the broadcast and puts the last sent map back.
It opens the way you left it: every layer and setting you had on is still on, and only the camera (centered on your area, flat) and the 3D volume start fresh.
- Two, three or four maps at once, each panel with its own layers and a header, and a Sync between maps menu for what they share: the view, the time, the radar site and the model run
- Sixteen one-click quick buttons for your favorite products or layer bundles (keys 1 to 9, 0, - and = for the first twelve)
- Layer bundles: save the layers on the map and all their settings under a name, then bring them back in one click, edit them or delete them
- A play bar with first, back, play, forward and newest buttons, one Window choice from the past hour to the next 16 days (the past, the model's forecast, or both), a speed of Slow, Normal or Fast, an end pause, any layer with pictures in time setting the pace with one click, a strip under the slider that ends where the pictures end, and smooth in-between frames that follow the storms (one click turns them off)
- Every picture there is: the national radar every 2 minutes, one radar every scan
- The preview is drawn at the Output's own size, so the city names, the zoom and the flat-or-globe switch are the same in both, whatever size the Console window is
Live NEXRAD, straight from the radar.
Choose any WSR-88D site, or let AtmoDeck pick the closest to the map center. Level II is decoded on your own computer from NOAA's public archive, so you see the radar's own gates, not a resampled mosaic.
The sweep, as it is made
With Live on, AtmoDeck reads the radar's real-time chunks. The picture appears wedge by wedge as the scan line passes over it, and the newest whole scan shows in seconds, not minutes. Between scans a steady scan line keeps turning, one for each radar on the map.
Super-resolution
One radar's sweep is drawn from its own 250 m gates at any zoom, so it stays crisp instead of turning into blocks. Crisp or smooth is a switch and a slider per product.
Every product
Reflectivity, velocity, storm-relative velocity, spectrum width, ZDR, correlation coefficient, PhiDP, KDP and a hydrometeor classification. Level III too: VIL, echo tops, hybrid scan reflectivity and rain totals.
Cleaned data
Ground clutter, birds and insects are removed from the correlation coefficient, texture and more, and folded velocities are unfolded region by region (dealiasing), so inbound and outbound show as clean regions.
Rotation markers
Groups of strong azimuthal shear inside real echo get a ring and a label, colored and spun by severity, and standing up as a funnel in 3D. They mark radar-indicated rotation; they do not confirm a tornado.
Scope and cross sections
A circle that follows the mouse swaps in another product of the same scan (velocity by default). Drag a line for a vertical cross section of any product, as raw blocks, soft or smooth, in a panel, standing on the map along its line, or both; drag its ends and it is read live as it moves. Both sit on the tool rail beside 3D. Several neighboring radars can blend into one picture.
- Multiple radars at once, with the same settings as one
- Tornado debris signature (TDS) product
- Tilt list by angle
- Storm cells with forecast positions
- Mesocyclones and TVS: click for their details and tornado intensity guidance
- Wind profile panel
- Precipitation type coloring
- Hail size (MESH)
- Color tables: import .pal files, build your own
The whole country, in 240 products.
The national radar is NOAA's MRMS system, decoded and drawn on your graphics card at full resolution. It covers the contiguous United States and updates every couple of minutes. Canada uses Environment Canada's radar, and a "both" mode draws the two together.
- Reflectivity at several altitudes, composite and at a temperature level, echo tops and heights
- Precipitation rate and type (rain, snow, sleet, freezing rain and hail, each in its own colors)
- Rain totals, MESH, VIL, POSH, azimuthal shear and rotation tracks, lightning, flash-flood guidance
- Every RTMA and NDFD product: temperature, dew point, humidity, moisture, pressure, wind speed and direction, gusts, visibility, ceiling, cloud cover and the hourly rain analysis now, and the forecast out to a week with rain, snow, ice, snow level, heat stress, waves, severe and significant severe chances and tropical wind chances
- Each product remembers its own color table, hide-below floor and smoothing; tables can be shared by kind
- Rename any product, satellite pictures and model fields too, and the header says your name for it
Legends that speak
The legend puts words where the values are: hail from pea to baseball, wind from light to extreme, rain "Light to Hail", velocity "Across beam". Every value shows its unit, and you choose units, numbers, another unit or words per product. Every layer with a legend has a legend button beside its eye, and a Legend menu in the top bar lists every legend on the map: hide any one, or all of them, and it stays hidden until you show it again.
Smooth motion
Frames blend into each other in one continuous motion, and the blend follows the echo's movement, so a storm advances instead of ghosting.
Quick and light
Changing the map's look does not reload the radar. A health check redraws a frame that fails to appear, and rebuilds the radar if the graphics card resets.
Every band, from seven geostationary satellites.
GOES-East and West, Himawari, GEO-KOMPSAT-2A and Meteosat, with the pictures CIRA and RAMMB SLIDER make of them: all 16 bands, GeoColor, RGB composites, cloud products, the lightning mapper and water vapor. Regional sectors, including CONUS, and the moving mesoscale boxes are supported. Any picture can be smoothed, and a visible picture can drop its ground and sea so only the clouds show.
A smooth loop
Each picture fades into the next, following the radar scan on screen or playing by itself, and the timeline moves with it (or sets the time for the radar). New pictures join the loop every minute, and a slow download never holds it up.
Color tables and sandwiches
One-channel pictures take any color table (installed, edited color by color with its opacity, or on the picture's 0 to 100 scale like cyclonic IR), and can show only the levels you want. Lay one picture over another, infrared over visible, with a blend mode such as multiply, screen, darken or lighten.
Real 3D satellite
Tilt the map and the picture stands up as one solid surface with every pixel raised to its cloud top, colder is higher, in the picture's own colors: sharp towers and walls like a satellite 3D loop, or rounded into domes, with a height slider and its own light, on the flat map or the globe, playing with the loop. Columns and real clouds lit by the sun are there too. Heights are an estimate, not a measurement. It works on every band, visible, water vapor or infrared, because the heights are always read from the infrared picture’s own pixels.
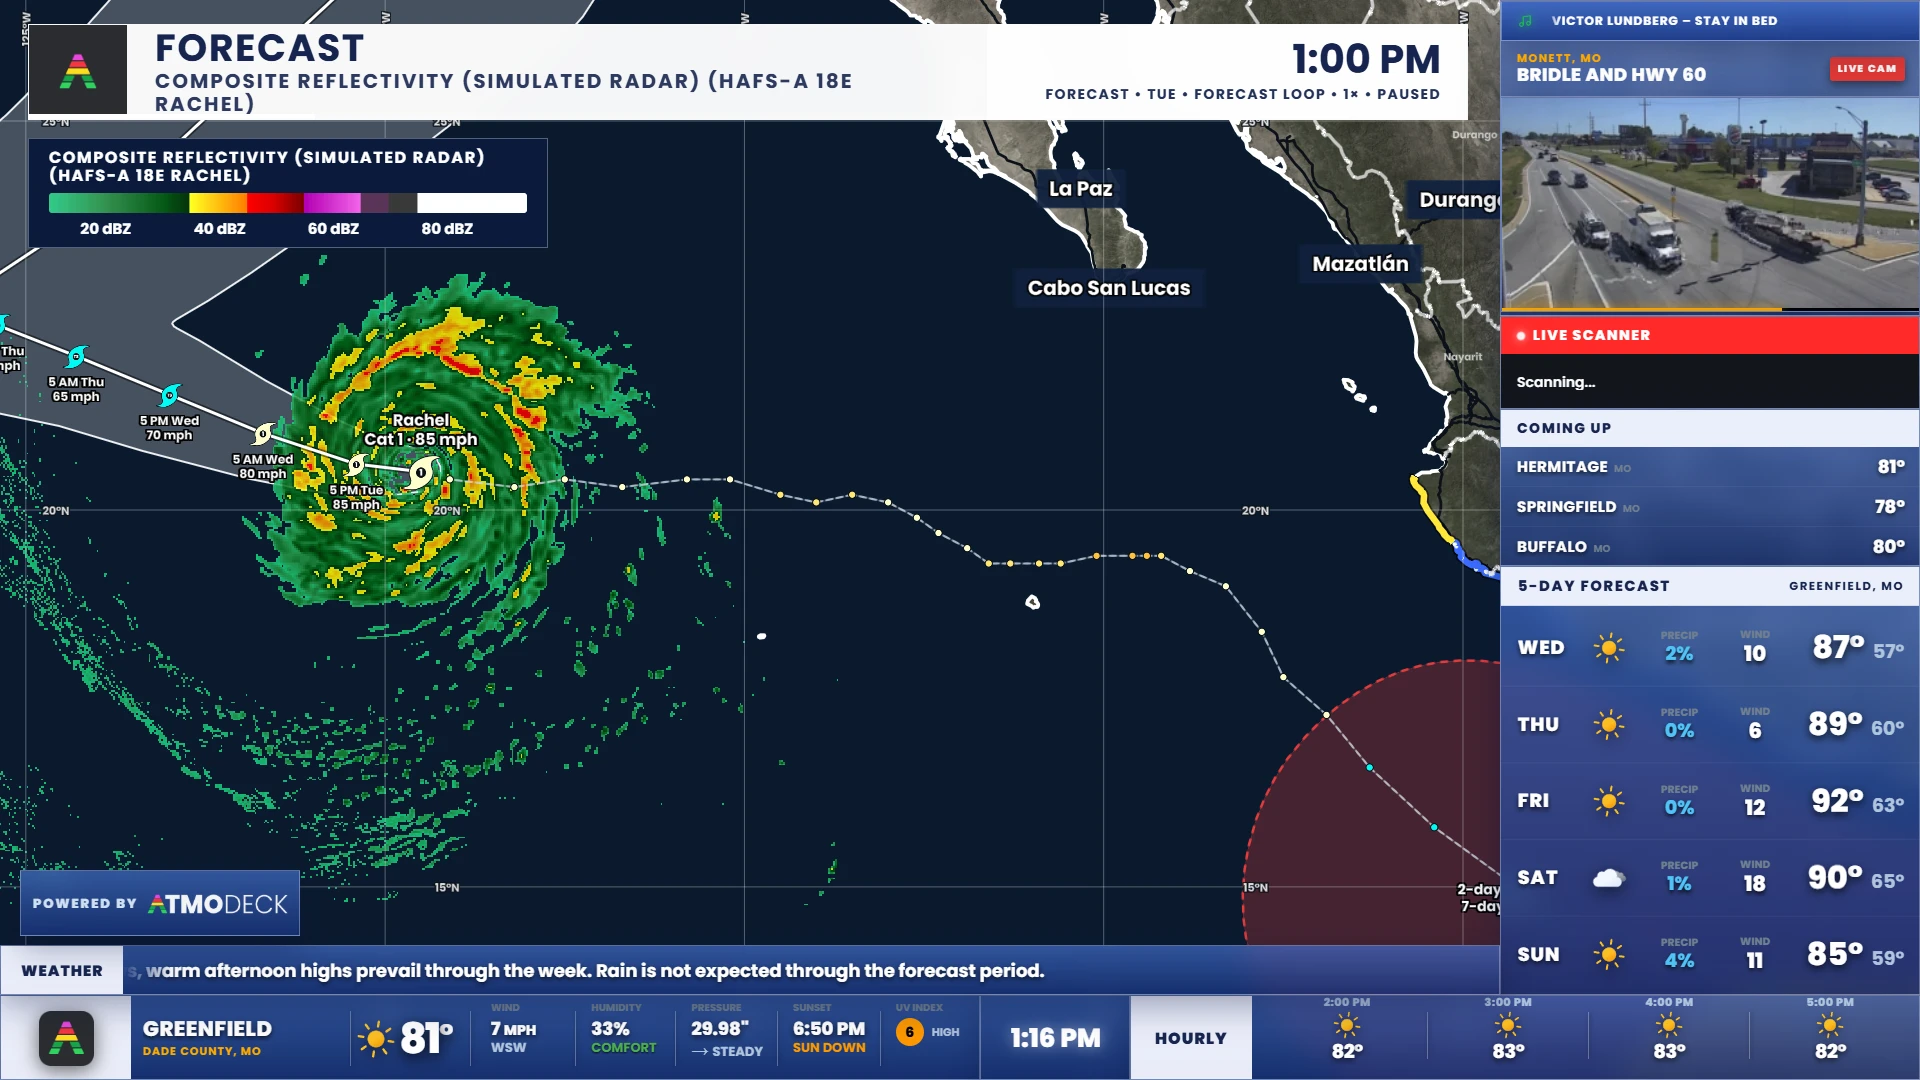
Every hazard, drawn under your radar.
The Outlook/Forecast tab draws SPC convective outlooks and storm reports, WPC excessive rainfall, fire weather and dry thunderstorms, winter storm severity with snow and ice chances, and NWS HeatRisk. Each area is named once, in your map font, and the fill, the outline (width, strength, dashes), the names and the color of every level are yours to set. Storm reports are one tab with round badges for every kind (tornado, funnel, wall cloud, hail, wind, flood, snow, blizzard, ice, lightning, fog, heat and more): the day’s SPC reports and the Weather Service’s local reports, a card when you click one, and they arrive in the Alerts box in a soft tone and zoom to the report when clicked.
Warnings and watches are set from the Alerts box at the top of the Console, and they follow the loop: every past frame shows the warnings that were in effect at its time, with each polygon as it was then. A selected watch fetches its full text. Two switches add the rest of the Weather Service's alerts, both on at first: hurricane, tropical storm and storm surge watches and warnings, and every other alert (advisories and statements, heat, wind, fire weather, fog, coastal flood, marine and the others), each in its own color.
Model tracks, recon, surge and flooding roads
Spaghetti plots draw every Hurricane Center model track, colored and named, for as many hours as you want. Aircraft recon draws live hurricane hunter flights, center fixes and dropsondes. Tide gauges and the STOFS surge model show the water coming ashore. The Water & flooding tab draws flood and hydroplaning risk on the roads themselves, from radar rain rate and terrain.
The tropical layer
Cone, forecast track with time and wind at each point, past track, watches and warnings that follow the coast along their whole length and appear within a minute of the Hurricane Center issuing them, wind fields, arrival times, wind probabilities, peak storm surge, the potential storm surge flooding map, SLOSH surge by hurricane category and the development areas. Colors, lines and labels are yours to change. The Cross section button also cuts the hurricane models: drag a line near a storm and a slice from the ground up through its HAFS model (wind, simulated radar, temperature, humidity, vertical motion or vorticity) appears in its own panel.
The weather models, on the same map.
The Models tab, in groups (storm-scale, regional, global and AI), draws the HRRR, the Rapid Refresh (RAP), the REFS ensemble (its mean and its probability-matched mean), NAM Nest, NAM, the National Blend of Models, the GFS and the GEFS mean, and the free AI models: NOAA’s AIGFS and the European Centre’s IFS and AIFS, with every weather-map field their newest run publishes: 90 to 130 products a model, from temperature and winds aloft to CAPE, helicity, simulated radar and smoke. Only the one field a picture needs is downloaded, the newest run (or the newest full run) is used by itself, and the loop starts with the hour that is now.
Every field, from the run itself
The lists are read from what the newest run really contains, grouped as temperature, moisture, wind, pressure and heights, precipitation, snow and ice, clouds, simulated radar and satellite, storm ingredients, fire and smoke, and the blended forecast's chances. Look ahead from 6 hours to 10 days.
A narrated futurecast
Step through the forecast (now, then every few hours) instead of looping it. Each stop holds for a few seconds, the pictures blend from one to the next, and the header says the time in words: "Tonight 9 PM". Save it as a slide and it plays in the slideshow.
Severe-weather environment indexes
Three products only AtmoDeck makes, worked out from several model fields: a tornado environment index, a supercell index and a large-hail index. About 1 is a setup where that storm is possible; several is one forecasters watch. They show where the ingredients meet, not where a storm will form.
Past, present and future in one loop
The play bar's Window is one choice: the past hour or day, the model's forecast, or both. Next 5, 7, 10 and 16 days reach as far as the model does (the GFS and GEFS 10 days, the NBM 8, the ECMWF IFS and AIFS 15, NOAA's AIGFS 16), and a model that stops sooner shows what it has. The strip under the slider ends where the pictures end.
Smooth when you want it
A Smooth button on the tool rail blends a model's blocky cells into a smooth field, and a model's simulated radar and clouds glide from one forecast hour to the next along the storms instead of fading.
Pick the run
Model run lists the last ten runs of a model (for example Run of 00Z Oct 7) as well as the newest. The run you pick is used for every model layer on the map, the hurricane model under a storm included.
- One color table for every product of a kind
- Model maps wear the colors you gave the map of now
- Compare the same field in another model with one click
- Units in US or metric
- Every model product has its own legend words
The weather map of a TV forecast, moving.
A second Map Studio tab for the fronts, highs and lows, drawn on the same map, flat and glossy or as 3D solids floating over it, over a timeline of keyframes that plays as a loop, a slide or a video.
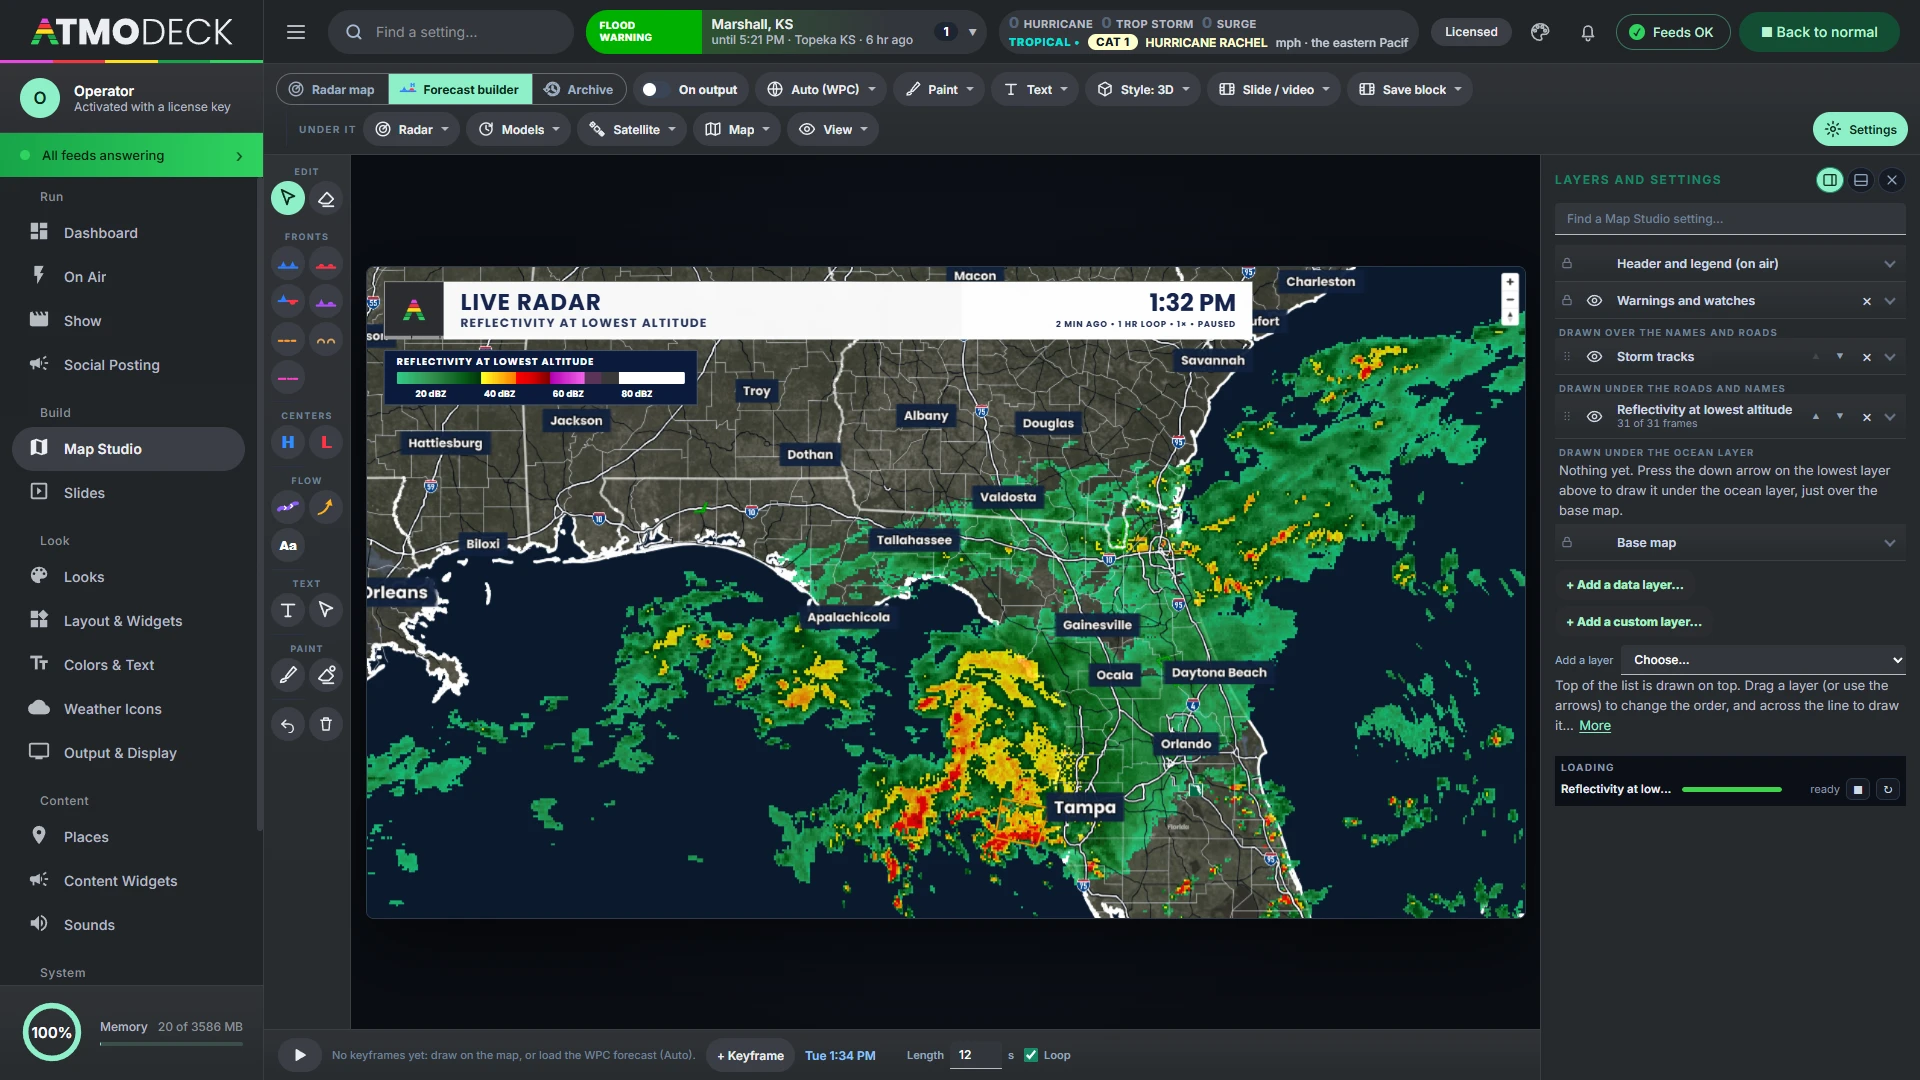
Every piece of a surface map
Cold, warm, stationary and occluded fronts, troughs, drylines, squall lines, highs and lows, arrows, the jet stream and labels. Lines bend gently as you draw them, and turning arrows circle the highs and lows.
From the Weather Prediction Center
One click loads WPC's surface analysis and forecast fronts as keyframes out to two days. Edit any of them, or draw your own.
Paint the forecast
Spray rain, snow and risk areas on the map in any color, under the lines and over the land, with hard or faded edges, outlines, opacity and blend modes (multiply, screen, darken, lighten), and the ocean over it if you like. Painting over a color replaces it, and the edges smooth themselves.
Text with a shine
The map's styled text, in your broadcast font with a shine and a shadow, placed, moved and resized right in the builder, and saved to a gallery.
Moves the way weather moves
Between keyframes each front and center is followed by its own motion, along a smooth curve, fronts stay on their lows, and a front travels across the map instead of morphing into the next one.
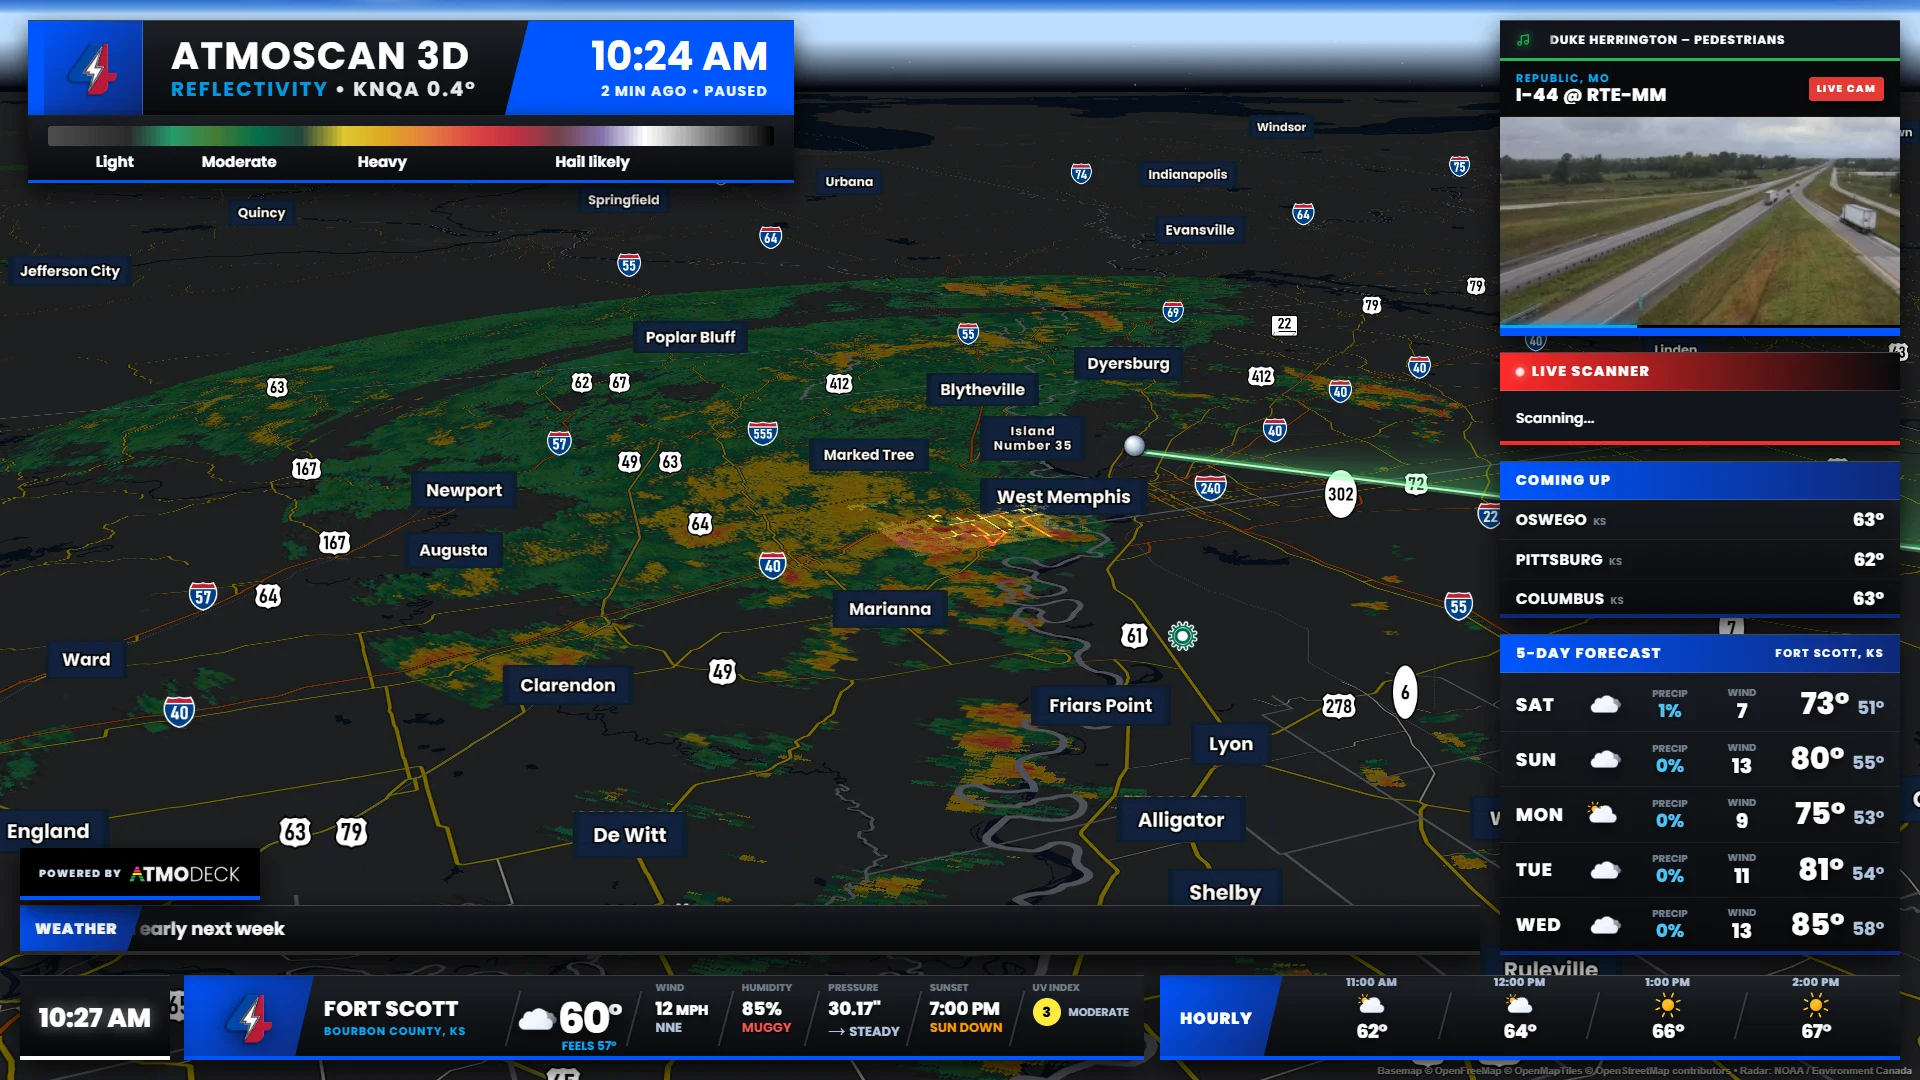
The whole volume, standing up on the map.
Every tilt of one radar becomes a 3D volume that you rotate and tilt on the map itself, for every product. Draw a box on the flat radar and the map zooms and tilts into it.
- New in 2.8 Wind streaks: the storm’s wind drawn from the radar’s own velocity, no model, rising in the updrafts in orange-gold and sinking in the downdrafts in blue, with their length, opacity and number yours to set
- Turning, tilting and panning stay smooth, even over a big storm
- Real clouds: the volume as white and grey cloud lit by the sun, or drawn by precipitation type
- Models in 3D: the HRRR or the GFS stood up with the clouds, ice, snow, rain and graupel at every level, and its wind moving round them
- Smooth volume or blocks, with light direction, shadow on the ground, brightness and drawn alpha curves
- City names float on lines that stand up through the storm, and any echo in front hides them
- Vertical cross sections and a wind profile panel
- Leaving 3D flies the map back to flat, north-up
The storm as it looks from the ground.
Storm sky on the tool rail draws the storm in a box you drag over it: the clouds from the satellite, the rain, snow and hail falling from them from the radar, and the lightning lighting the clouds. The GOES cloud mask and measured cloud-top heights decide where the cloud is and how tall, from towers and anvils to overshooting tops, and the HRRR can add the cloud base and the drafts. Tilt the map to look at it from the side.
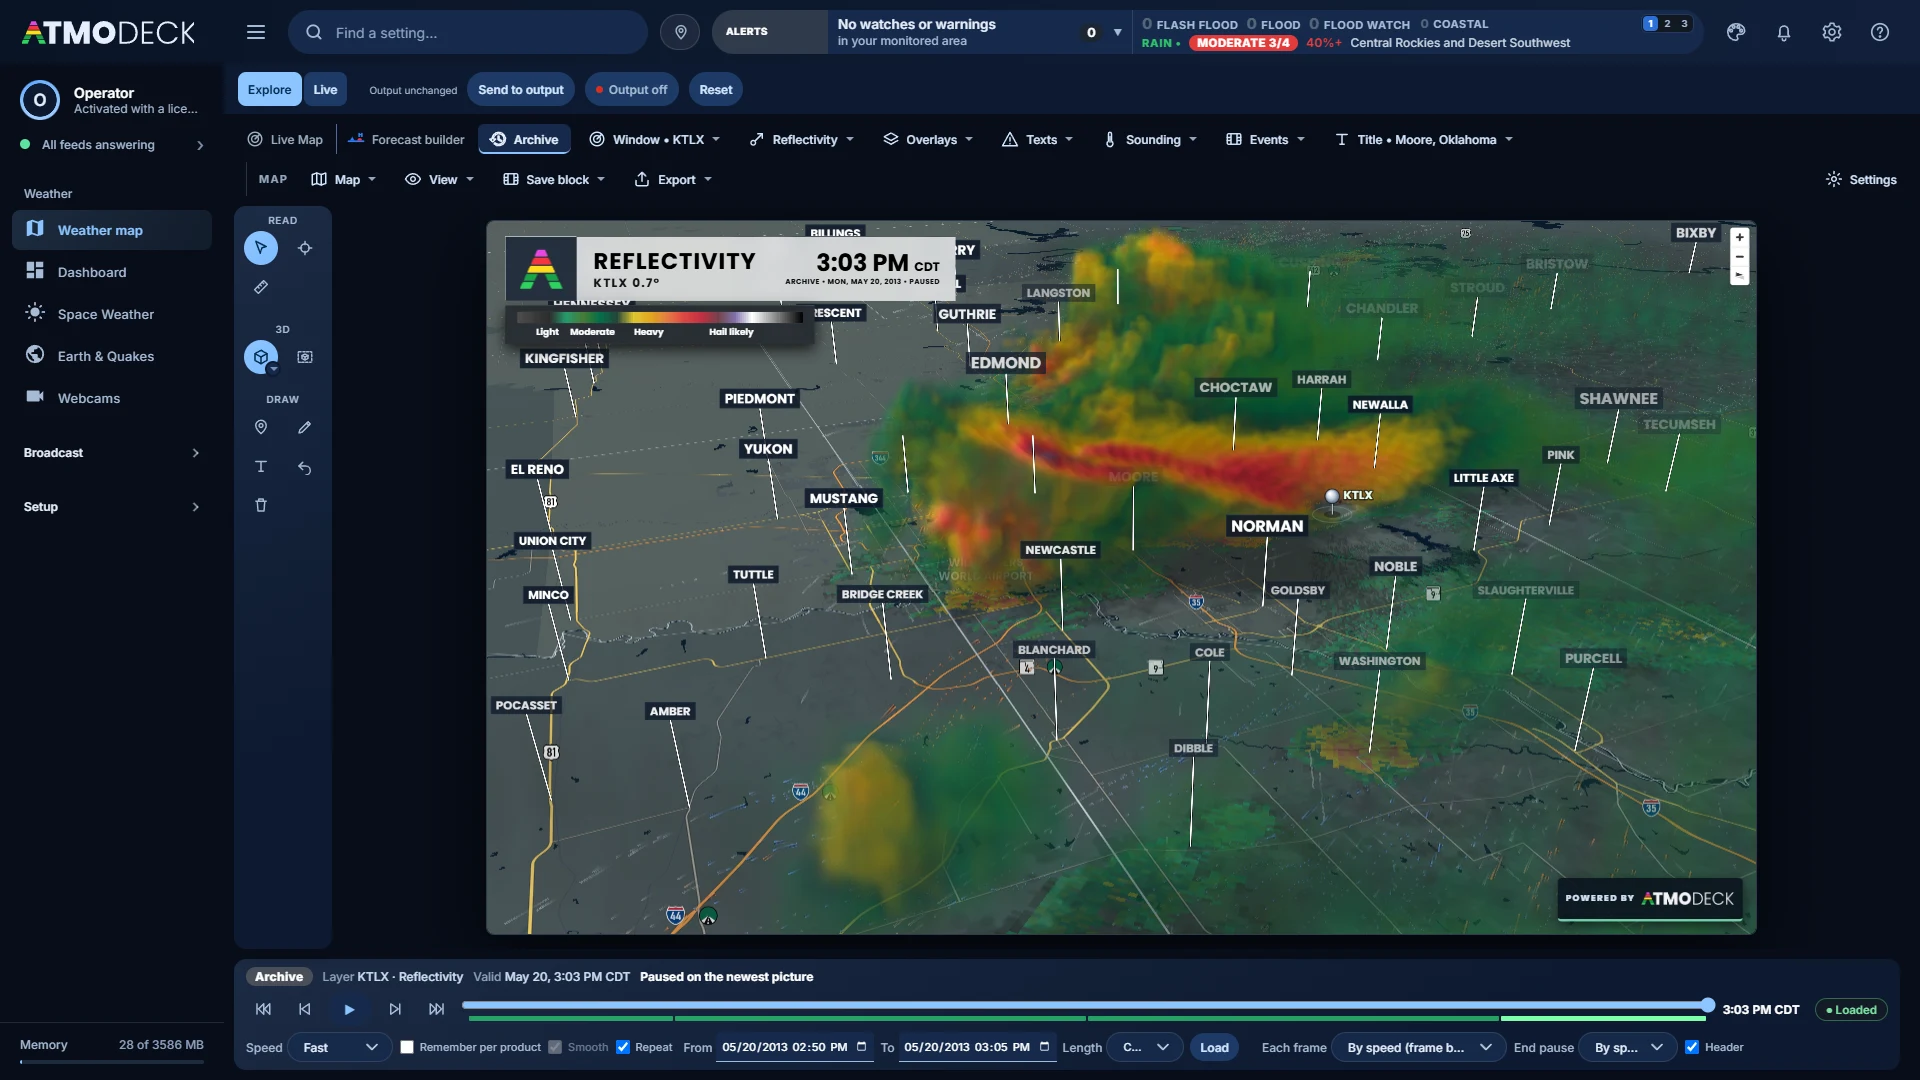
A radar of the past, with everything that was going on around it.
A third mode beside the Radar map and the Forecast builder, with its own settings that never touch your live map. Pick any radar and a window of up to three days, any time since 1991, and it plays the radar of the moment with the warnings, reports, damage and tornado tracks drawn the way they were. Give the header the name of the event and put it on air.
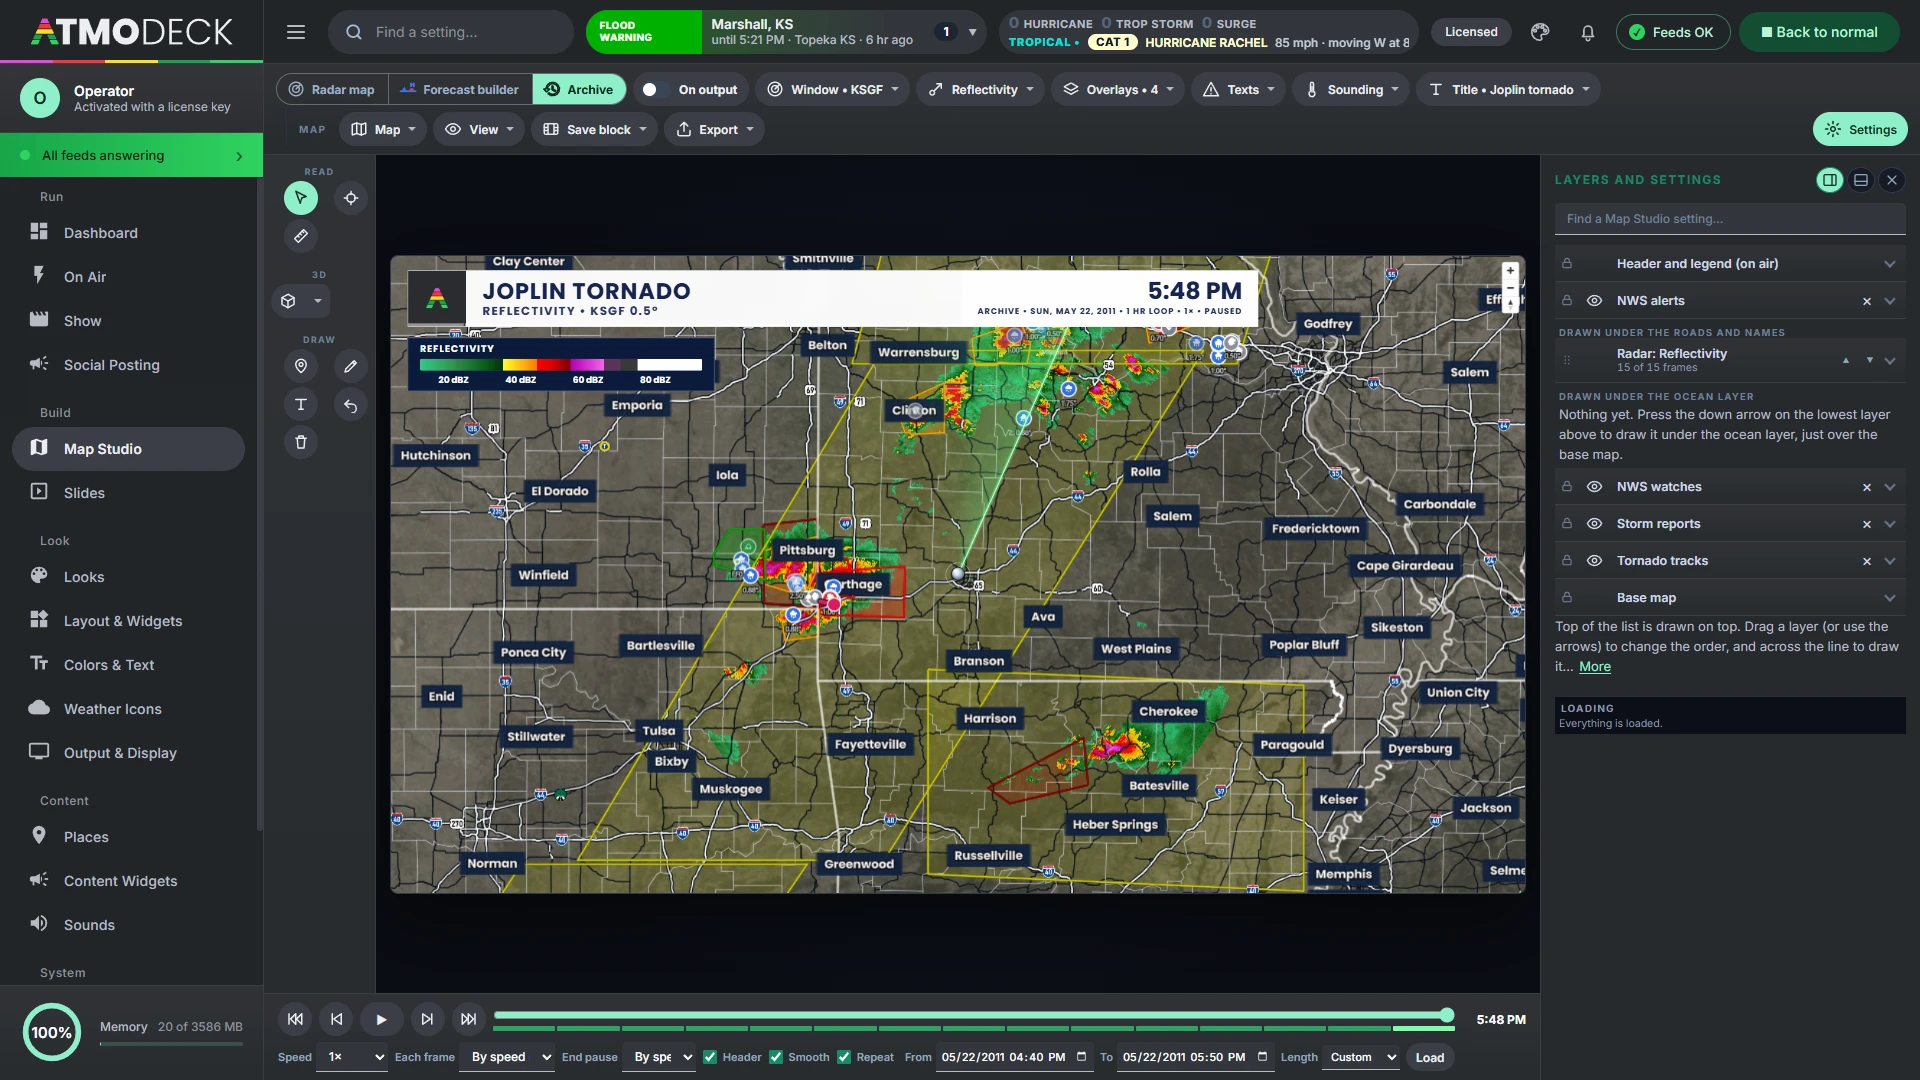
- Any WSR-88D radar, a window of up to 3 days and any date back to 1991, played in parts of about three hours when the window is long
- Warnings and watches as the Weather Service sent them, mesoscale discussions, and a Texts menu to read any of them in full, nearest the radar first
- Storm reports, NCEI Storm Events (deaths, injuries, damage and the forecaster’s narrative), NOAA DAT damage surveys, and every tornado track growing from touchdown to lift, colored by rating
- Airport observations, USGS river gauges at their stage at that moment, lightning and GOES satellite (infrared or water vapor) from 2018, and the whole country’s radar mosaic
- The SPC categorical, tornado, wind and hail outlooks that were in effect at each picture
- A Sounding menu: the weather balloon of the day drawn on the map, with its hodograph and storm numbers
- A title and a line under it on the header (“Joplin tornado”), the date with its year, and an ARCHIVE tag in place of LIVE
Stand the old storm up on the map.
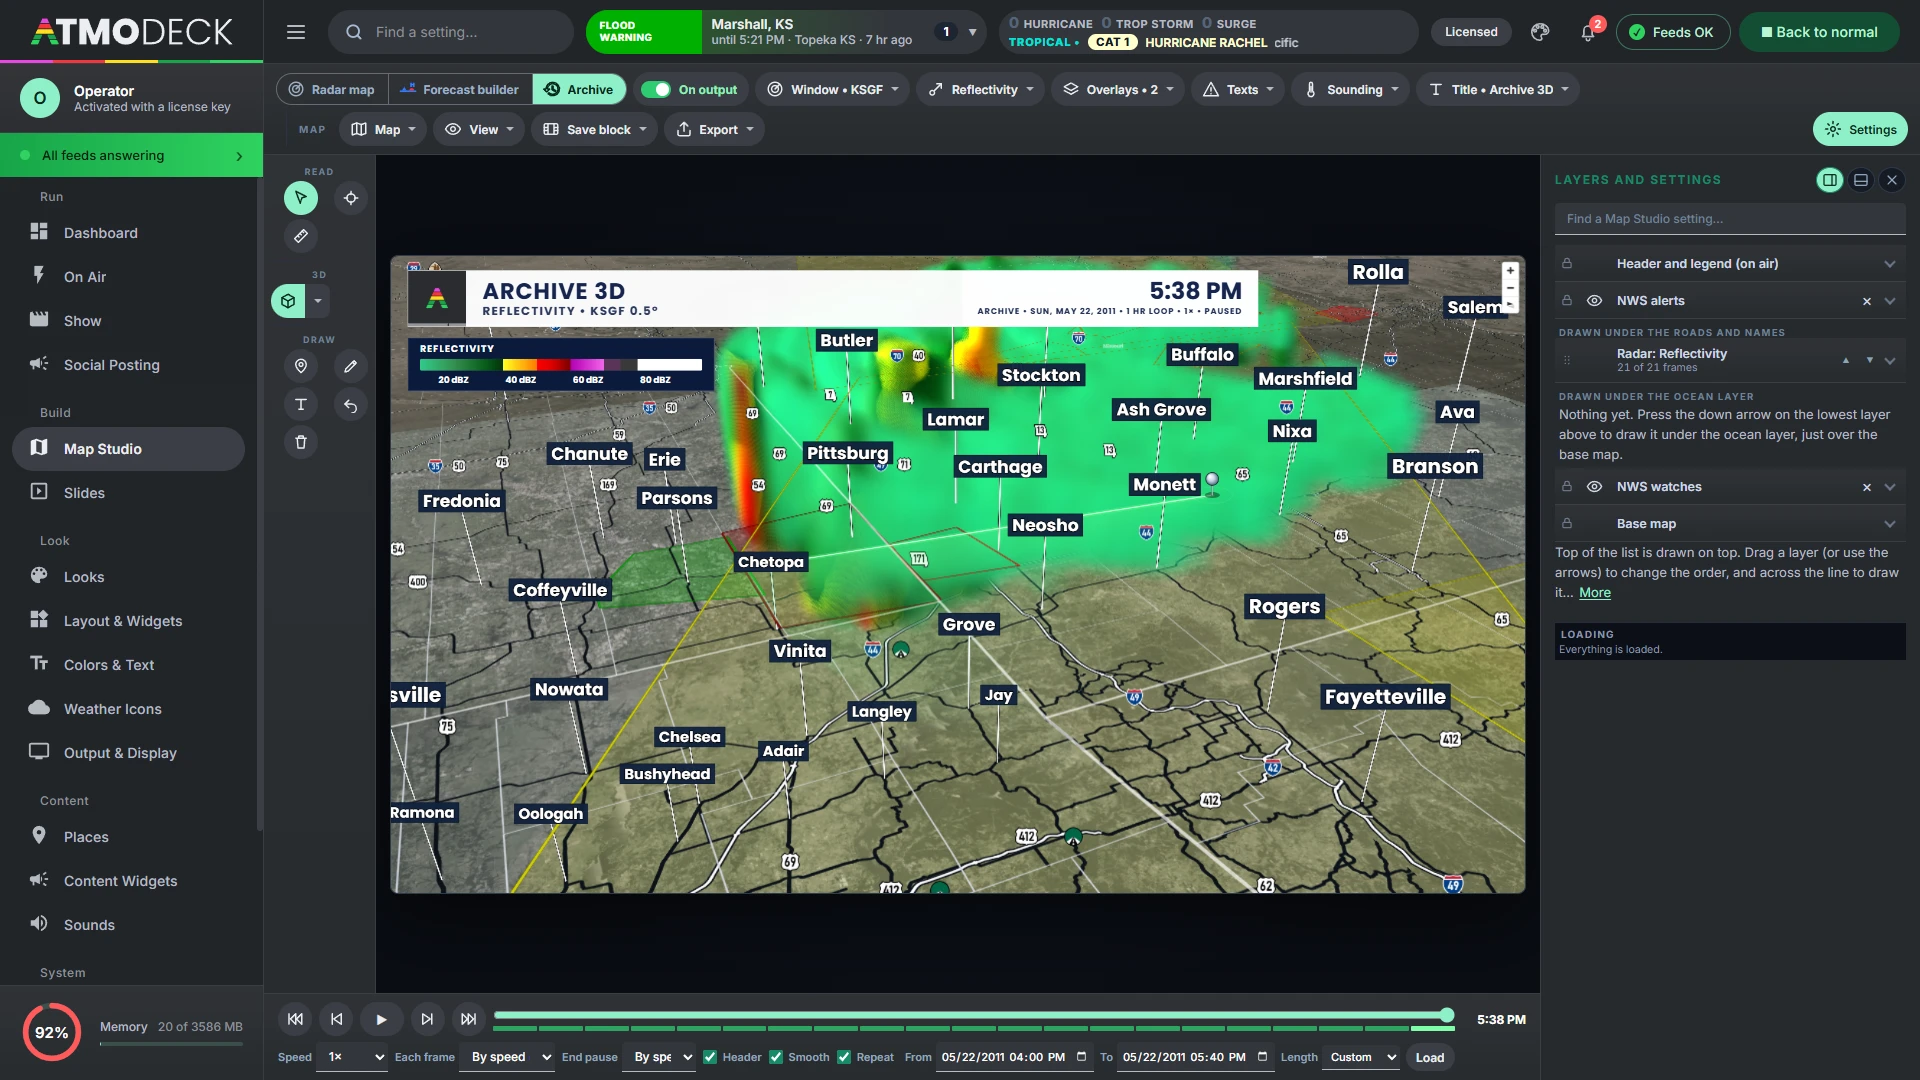
The 3D button works in Archive mode too, built from the archive’s own scans (the Joplin radar has fourteen tilts), tilted over the warning boxes. A 3D satellite stands the cloud tops up at their height, with a stretch from 1× to 8×; the height is estimated from how cold the top is, so it is a guide, not a measurement.
- Only what the archive holds is offered: a product, an overlay or a radar that did not exist yet for the dates is greyed out, with the year it starts
- Leaving the mode puts the live radar map back exactly as it was
- It can go on the Output like the live map, or stay in the Console as a preview
Good to know: satellite and lightning start in 2018, storm reports in 2004 and DAT surveys in 2010; the SPC tornado list runs through September 2025.
Analysis you will not find on another weather map.
Insight works on the live national radar and on any single radar. It is made from public radar data and shown as guidance for a presenter; none of it is a warning.
Every storm, scored and followed
Storms are found in the national radar, split where a line has separate cores, named and followed. Each is a dot in the color of its threat (Ordinary, Strong, Severe, Intense, Extreme, the same colors on the map, in the Top Storms list and on its card), with the path it has come along and where it is going in the next hour, marked every 15 minutes inside a cone for the doubt. Click one for its card (on the Output too, at the size you choose): strongest echo, hail, the water in it, how high it reaches, rotation, lightning, where it is going and the places it reaches in the next hour. The dots move with the timeline.
Where each one is headed
A storm's card lists the places it reaches in the next hour with the minutes to each, and the Output shows the same storms, with the same names, as the Console. They are aids for presenting, not warnings.
Tornado intensity guidance
Click a rotation marker, or the radar's own mesocyclone or TVS marker: the couplet and the debris signature are measured and the likely EF rating and peak wind appear, with the chance of each rating.
Tornado debris signature
A product for one radar that marks lofted debris: strong echo with a low correlation coefficient and ZDR near zero, right next to rotation, scored from possible to strong.
Real lightning
Every flash the GOES satellite sees, as a bolt, a plus or a smoothly pulsing circle with a soft glow, thinned with a density slider, and moving with the timeline: an older scan shows the lightning of its own time.
The map in your slideshow, and on air the moment you need it.
Map slides and videos
Save the map as it is (where it looks, the radar, the layers, the look) as a named slide with its own seconds and a loop switch. It shows in the slideshow like any other slide, always with the newest radar or model run, and is loaded behind the slide before it so it is ready when it appears. Export records the whole output as it airs, header, legend, ticker and widgets included, or the map alone, to an MP4.
Cut to it
Give a slide a hotkey and pressing it cuts the Output to that slide, over everything, even while the slideshow plays. The same key puts things back. The phone remote has a button for each slide.
A warning brings the map up by itself
With the automatic view on, a new tornado, severe thunderstorm or flash flood warning in your area takes the Output map to it, on the nearest radar, selected and on the threat matrix and the ticker, even while the slideshow or a show plays, and puts everything back when it ends.
- A picture of every slide as a 1920 by 1080 PNG
- A camera button on every playlist item
- Animated weather icons above the cities that follow the radar
- A legend as wide as the header
- The warnings and watches on screen listed in the legend
- Viewpoints and a tour that flies between them
- Map text with shine, shadow and a saved gallery
- Several radars at once, the sharpest always on top
- Sea temperature and waves cut off at the coast
Stack anything on the map, in any order.
Everything on the map is a row in one list. Drag it, or use its arrows, to change what is drawn over what, and across the line to draw it over the names and roads, under them, or under the ocean layer.
- Data layers: add any national map or model field over the radar, up to four, each with Fill, Line and Point tabs and, for wind, barbs and streaks
- Terrain: shaded relief, colors by height and real 3D ground from free elevation tiles, on the globe too (the 3D ground on the flat map)
- Custom layers: your own GeoJSON, KML, KMZ, shapefile or placefile, from a file or a web address, checked for updates as often as every 10 seconds, with the colors and widths the file asks for
- More layers: the Weather Prediction Center’s fronts, highs and lows (now, or its forecasts to 48 hours as a loop), AirNow air quality for this hour, today and tomorrow, the UV index, and aviation layers
- A second base map under the radar, whole, as place names only or as names and areas
- Everything that was on is still on the next time AtmoDeck starts; 0% opacity is fully transparent
A sounding, a mesoanalysis map or a forecast, for any spot.
Right-click anywhere in Map Studio for a menu about that spot. The results come up in a Popup Box you place and size in the widget editor, in the font and style of your broadcast.
SHARPpy soundings
The Storm Prediction Center's analysis for that exact spot, or the nearest observed radiosonde launch, worked out with the routines of SHARPpy ported into AtmoDeck and checked against SHARPpy's own output on 47 real soundings. The skew-T with parcel traces, effective layer and wind barbs, the hodograph with storm motions, the thermodynamic and kinematic tables, and three insets of your choice: storm-relative winds, storm slinky, theta-E, temperature advection, STP, SHIP, winter weather, fire weather and SARS analogues. Choose the parcel and the right or left mover under the card.
45 mesoanalysis maps
Instability, levels, wind shear and helicity, severe-weather composites, the surface and the upper air, worked out by AtmoDeck from the HRRR's hourly analysis. Each is an ordinary model layer, so its colors, contour lines and readings are yours to restyle. Pick one from the Mesoanalysis menu in the top bar, the right-click menu, or Add a data layer.
Forecast slides in your style
Current conditions, the next hours or the next five days for the spot, in the slideshow's own header, city line and cards, animated in as the slideshow does, with your own weather icons if you uploaded them. Esc takes it away.
The nearest radar
Jump to the closest NEXRAD for the spot you clicked in one choice.
Warning boxes
Ctrl-click a warning and a box sticks to it: when it ends, where, the hail and wind tags, the people it covers, and the hospitals and schools inside it. Drag them where they read best; Clear all takes everything off.
Tilt up to see the sky. Open it and the map is already there.
A real sky
Tilt the map (up to 85 degrees) until the horizon shows and the sky is drawn for the time of day: the real stars at night, clouds drifting by day, and the sun and the moon where they really are, the moon in its true phase. Close in, the city lights are sharp, lit from the map's own streets.
Fresher radar
The newest picture is the latest finished sweep of the lowest tilt, about every two minutes instead of every six and a half, and the live sweep draws radials as they come in. The map keeps pulling scans while it is out of sight.
Kept on disk
The ground, roads, names and imagery you have looked at are drawn from the disk first, and the satellite pictures of the US, Canada and Mexico are kept from the first start (zoom 0 to 8), so a tilted view that shows far away is already filled in.
Style the map until it matches your show.
Base maps and colors
Dark, light, bright streets, detailed, USGS satellite and a simulated satellite map that draws forest, farmland, desert, water and towns without downloading imagery, with every building and house in 3D when you zoom in and a base color of its own. Color themes such as Broadcast dark, Storm slate, Midnight blue and Clean light. Recolor land, water, parks, roads, borders and buildings.
Names and fonts
Any Google Font for cities, streets, water and markers, each with its own weight, size, color and outline. Boxes behind names have adjustable corners and padding, and three sliders thin out cities, towns and villages.
Lines and details
County lines, interstate and highway shields, and an "only my area" spotlight that dims everything outside your counties. Points you place on the map can be dragged.
Zoom out to a planet.
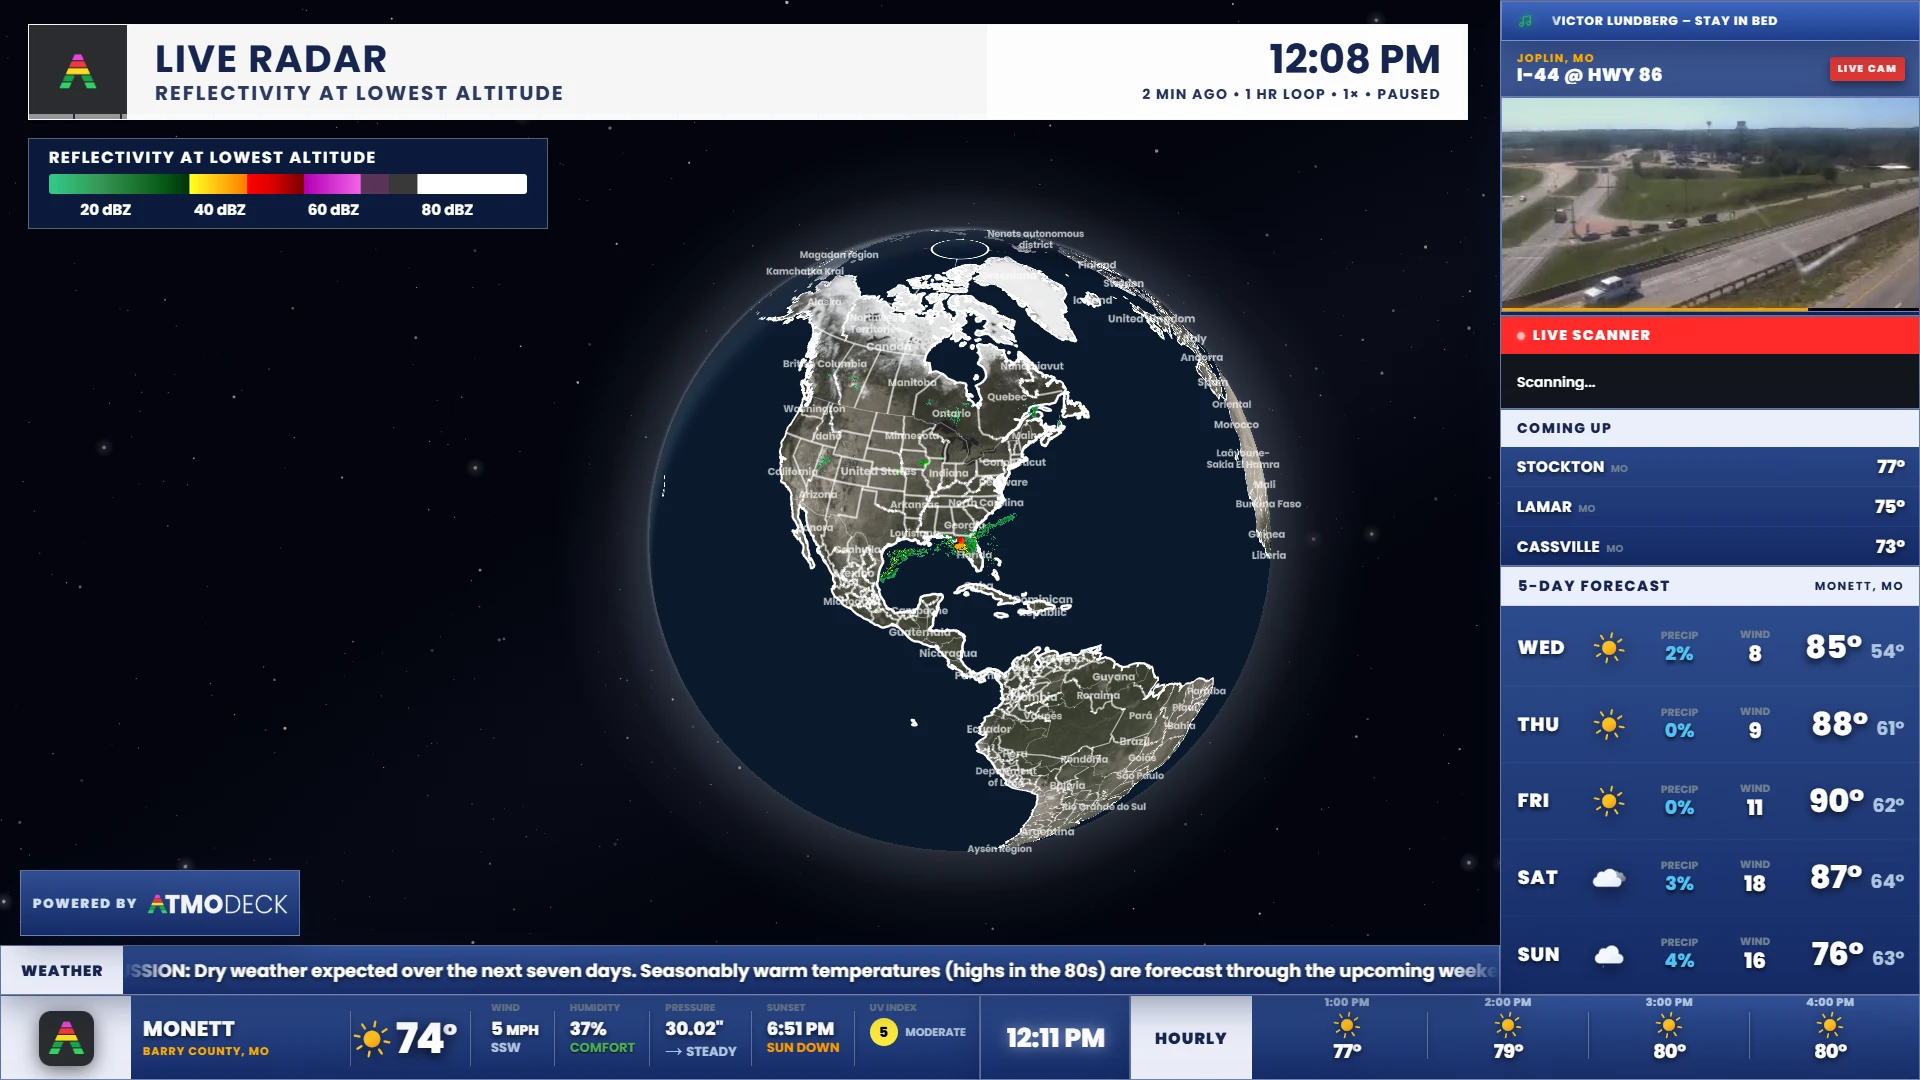
Globe mode adds an atmosphere glow and a starfield, city lights for the night side with their own brightness, and editable colors for the sky, horizon, haze and space. When you zoom in, the sky is blue in the day and dark at night, wherever the map is centered. Zoomed in, it opens out smoothly into the flat map, and curls back into the globe as you zoom out, with the radar and satellite drawn on it all the way.
Everything a presenter reaches for.
A header you can design
The header shows the product, time and a LIVE badge, dressed like your other panels. Upload your own PNG in the header creator and place each element yourself; a warning takes over the title (its details under the header, or sliding out its right side), and the legend can sit inside it. It stops where another widget begins on its right, and a long line goes on to a second line before it is cut off.
Storm tracks and arrival times
Click a storm, or drag a line of storms in any shape (a bow, a curve), and get a track, a cone and time marks. Storm speed is measured from the radar automatically, or aimed by hand, and a warning's own motion can be used. The towns in the way (only those inside the drawn track, spread from the first to the last) appear on the map and in one list widget with the time each is reached; Insight can add the strongest storms on its own.
Telestration
Pen, highlighter, arrows, circles, boxes and text that stay put as the map moves, and fade after a time you choose. Text can shine and cast a shadow in your broadcast font, be dragged into place, resized after it is placed and saved to a gallery.
Readings and measuring
Values above the cities, click to read any spot, and measure a distance with a circle.
Outlooks and warnings, drawn clean
One Outlooks layer for the SPC and the flash-flood, fire, winter and heat outlooks, with conditional intensity hatching; warnings and watches each with a global style, a watch outlined once round its whole area, and special weather statements if you want them.
Export
Screenshots of the whole output as it airs (the header, legend, storm times, clock and widgets) with one click, or Ctrl+PrintScreen even when OBS has focus, and MP4 or GIF videos of the whole output with its overlay, or of the map alone, in Explore too. The Powered by AtmoDeck badge is on every one.
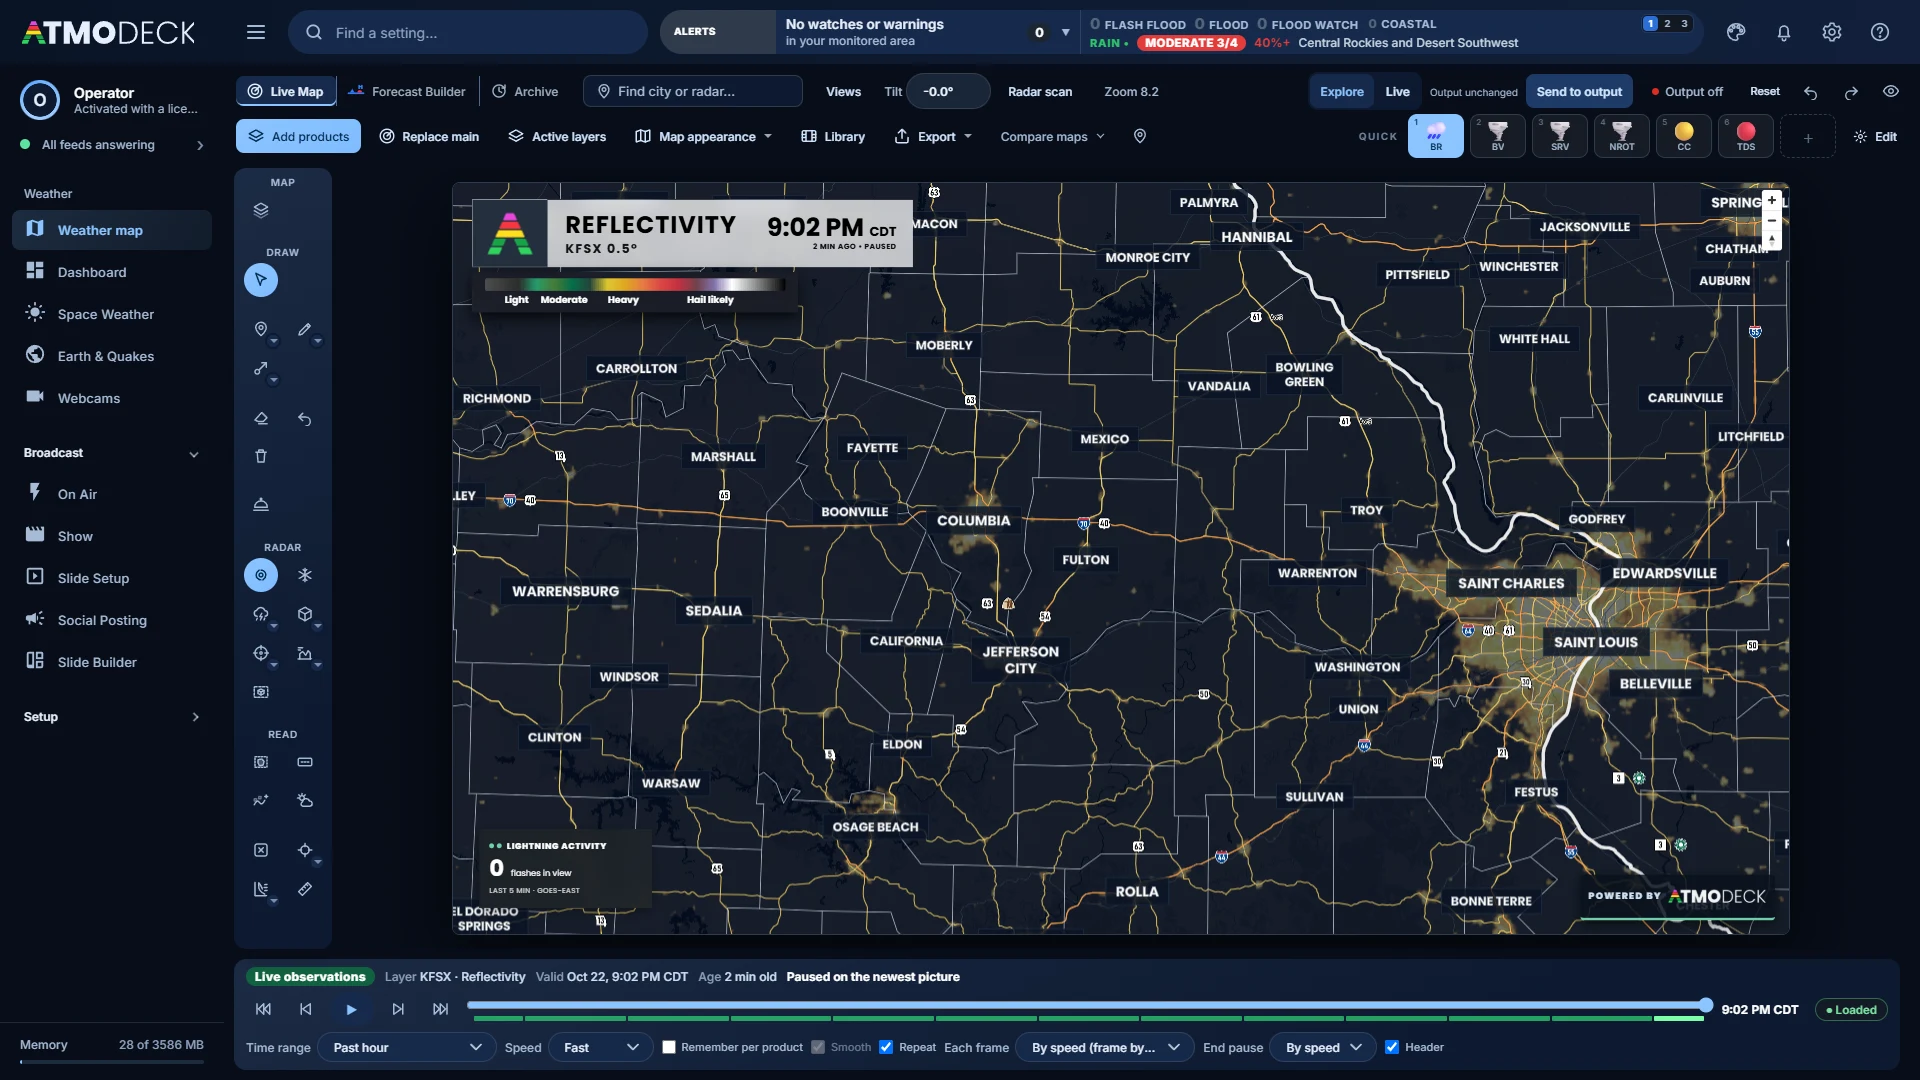
Live, or work in private first.
In Live, every pan, zoom and layer you change is on air as you make it, and the map wears ON AIR and a red ring so nobody forgets. Explore keeps the preview to yourself, with Send to output and Reset, and the switch reopens as you left it. Output on / off sits beside Send to output for the moments the map should step aside.
Put a real radar studio on your broadcast.
Live Map and Archive are included in every plan. Forecast Builder and custom headers require Solo, Standard or Pro. Start a 7-day free trial.