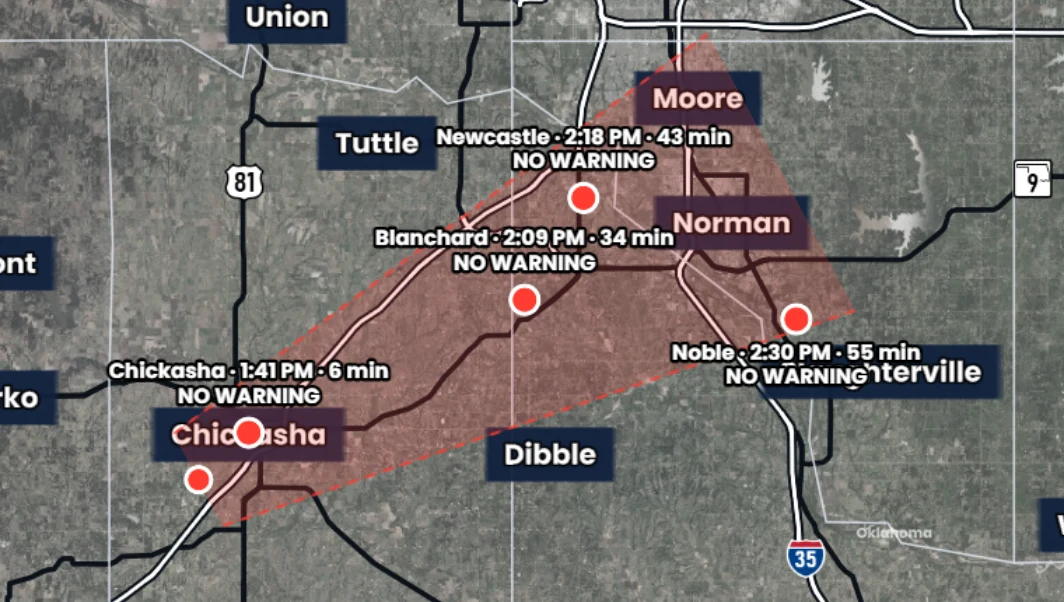
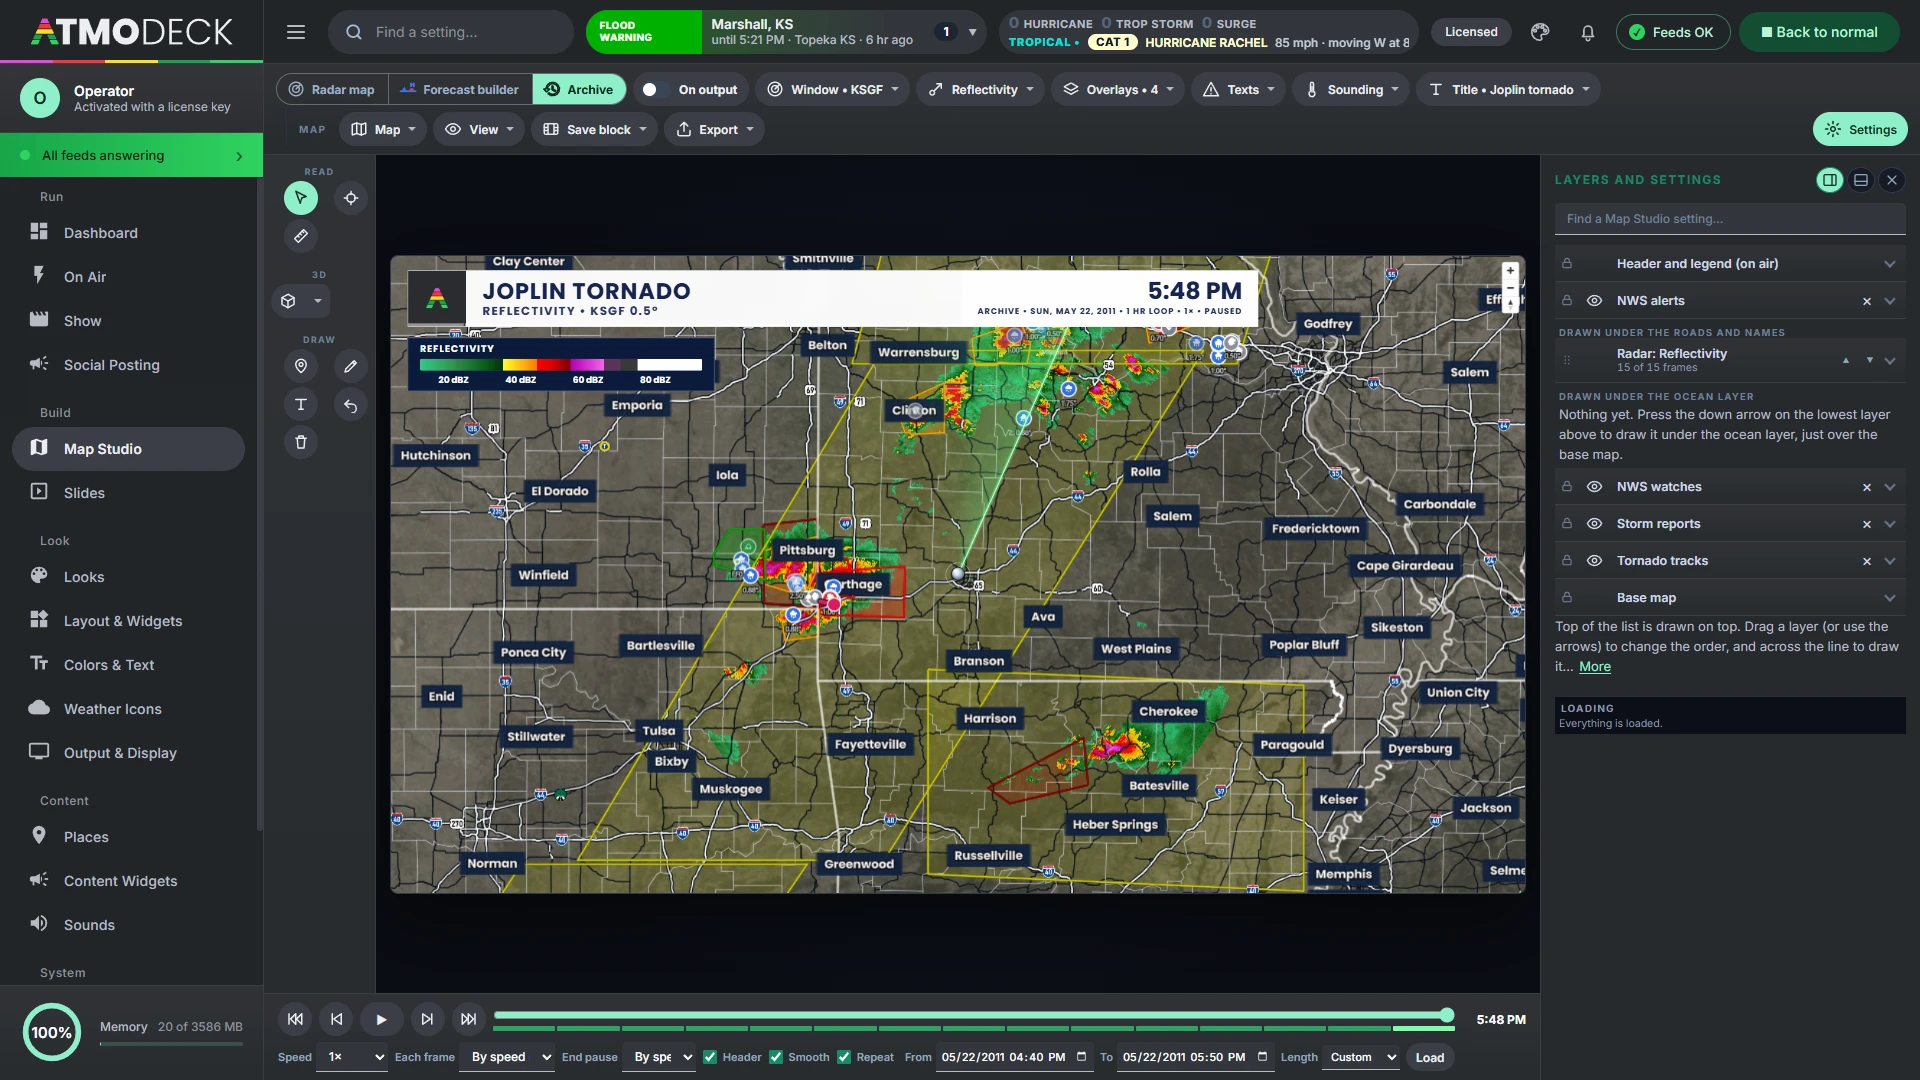
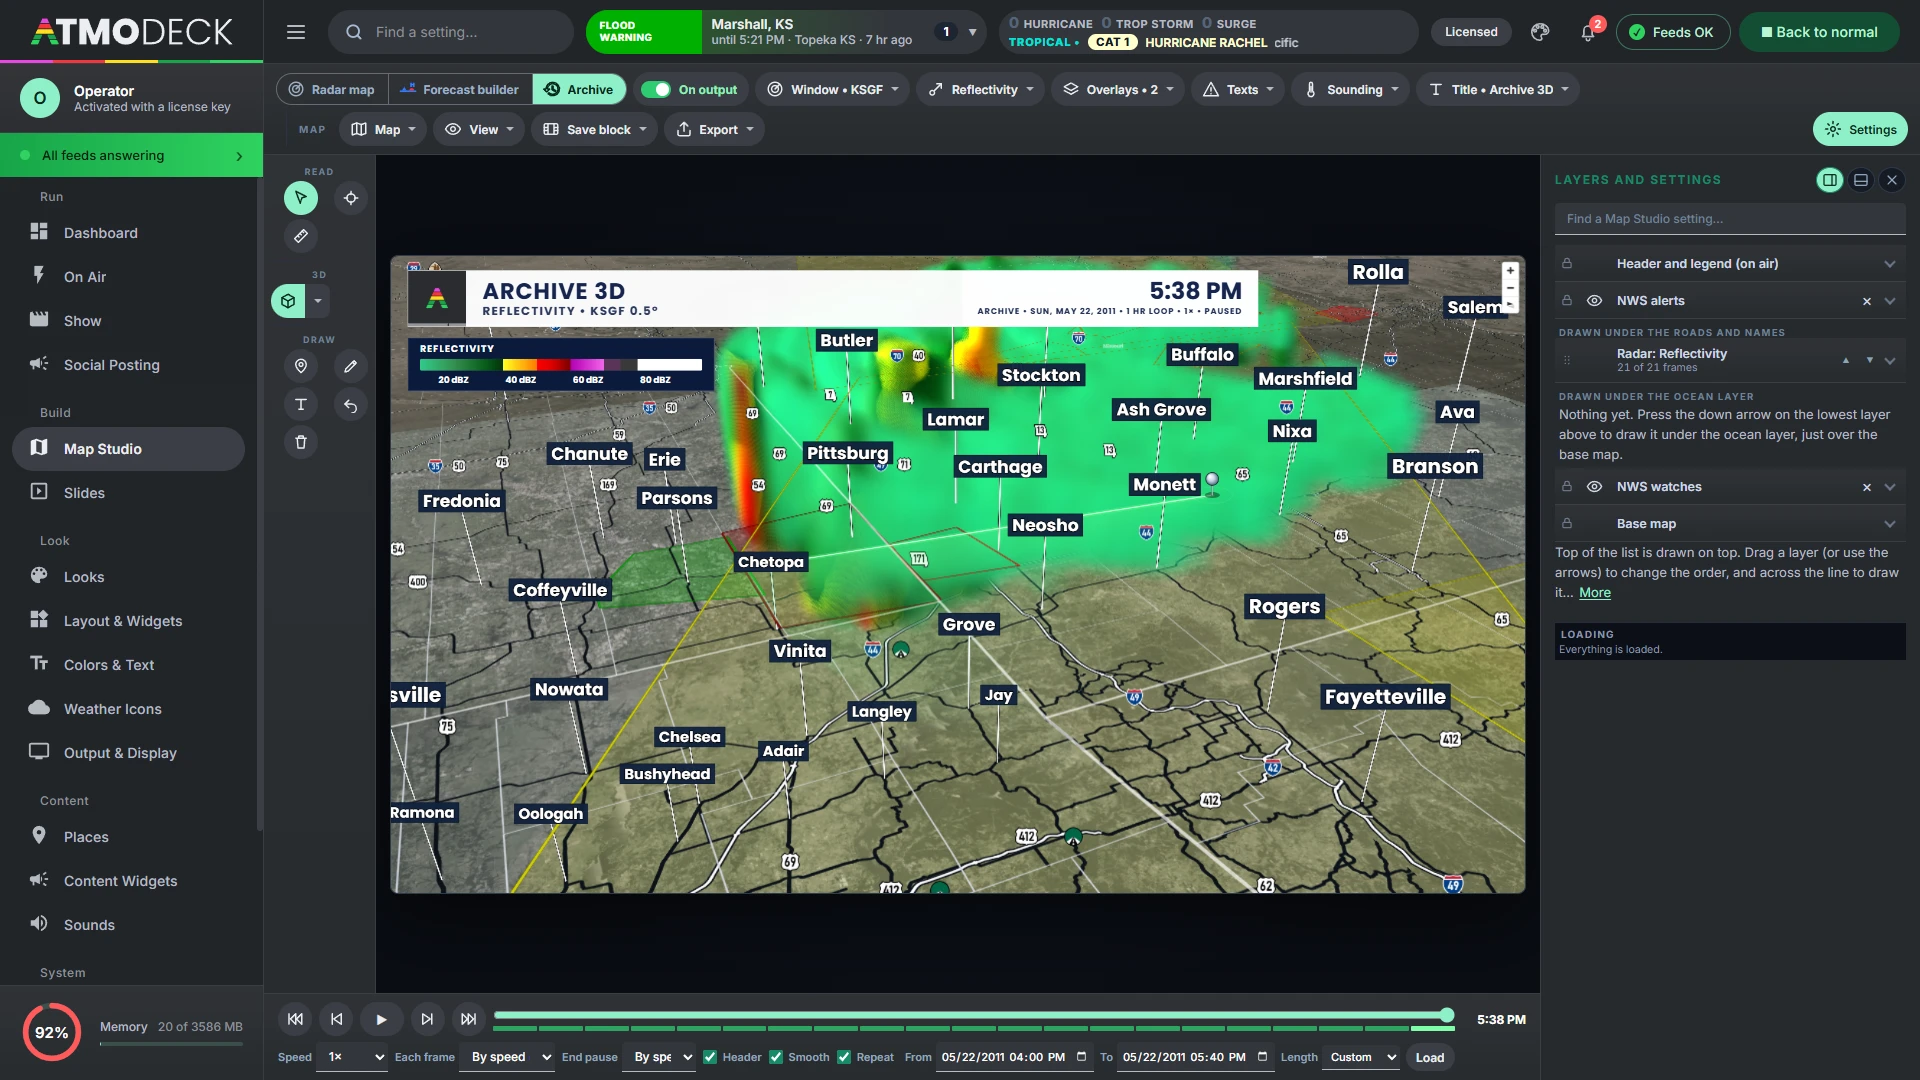
A complete guide from first launch to a finished broadcast, in the order you will need it. Start with Find it fast for everyday tasks, or search every word of the guide in the box above the contents.
Part 1Start here
What AtmoDeck is, getting it installed and on screen, and finding your way around the Console.
1. Welcome to AtmoDeck
Read this chapter first. It says what AtmoDeck is, how its two windows work and how this guide is laid out.
1.1 What AtmoDeck is
AtmoDeck is a Windows program that makes a live weather broadcast: the graphics that go on the air, and a control window to run them. You put one window of it into your streaming or production software (OBS, vMix, a hardware encoder) and everything an audience sees comes from there.
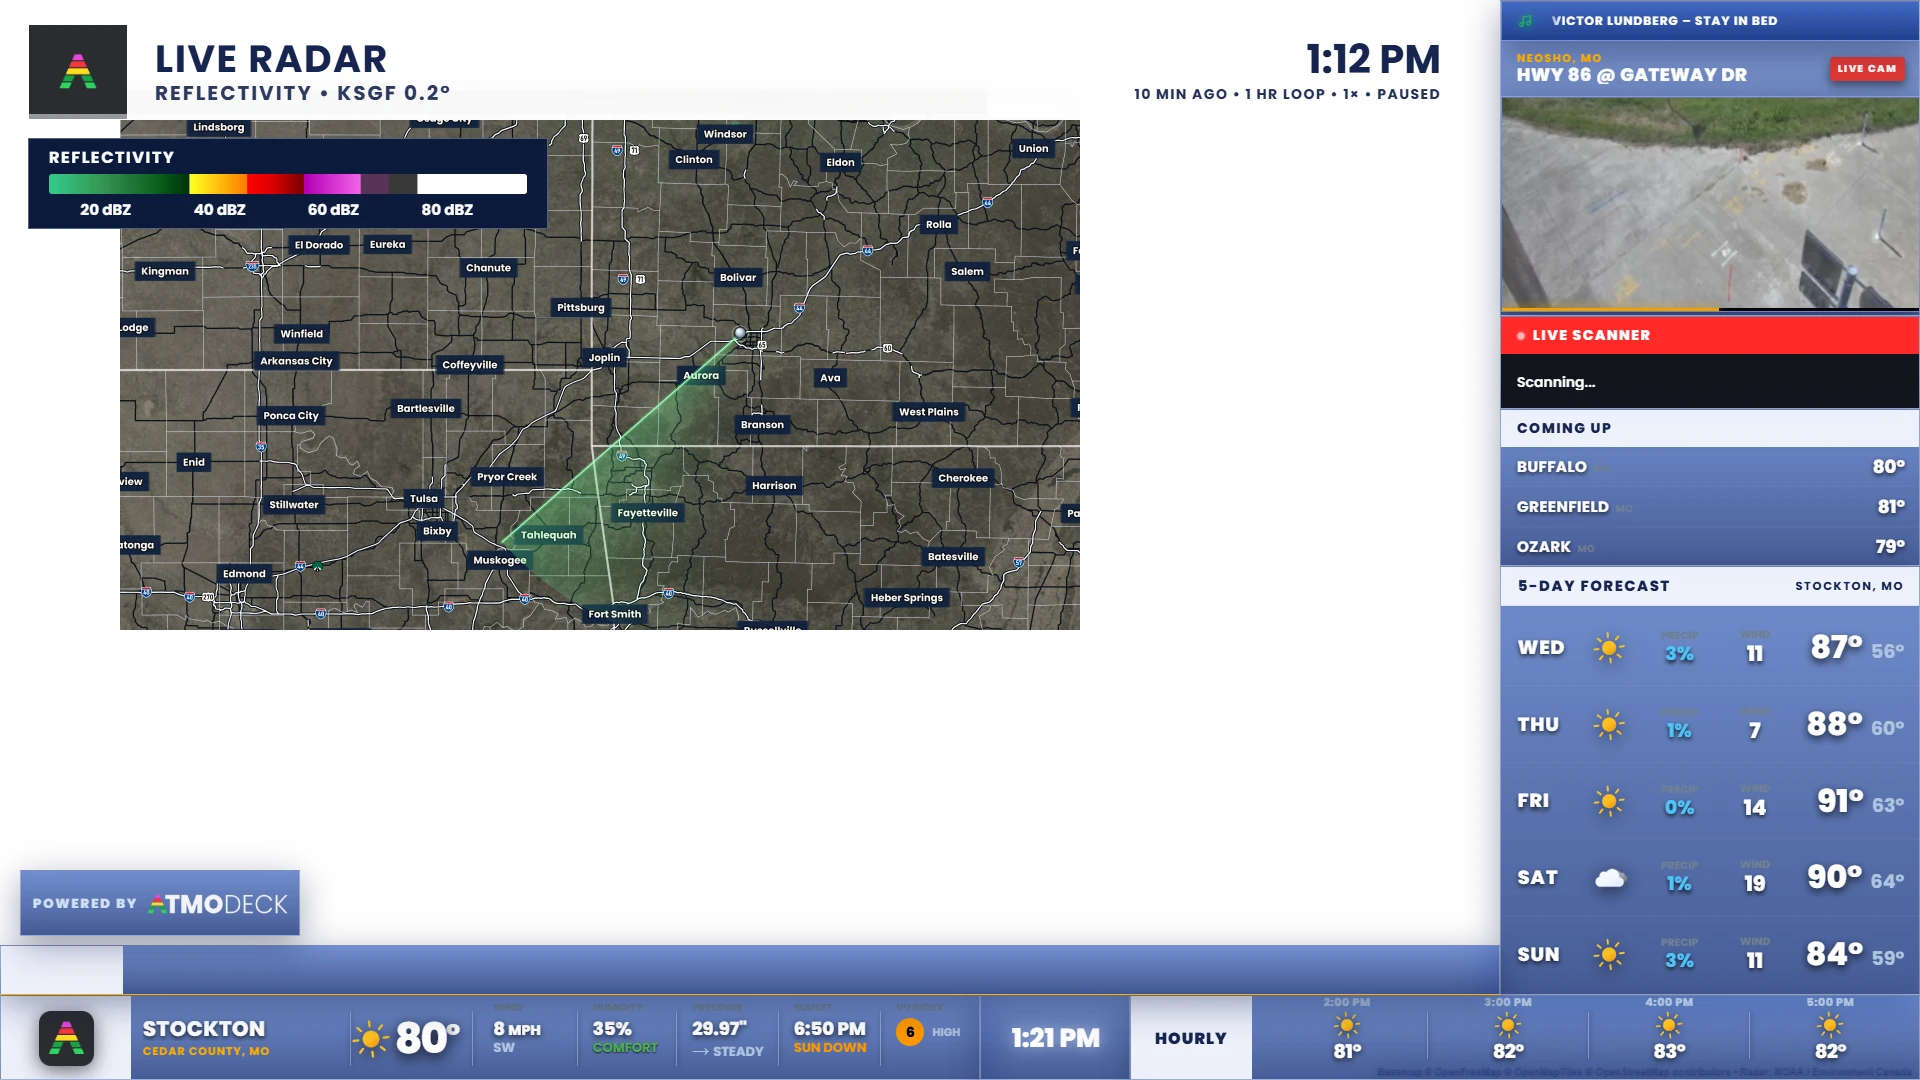
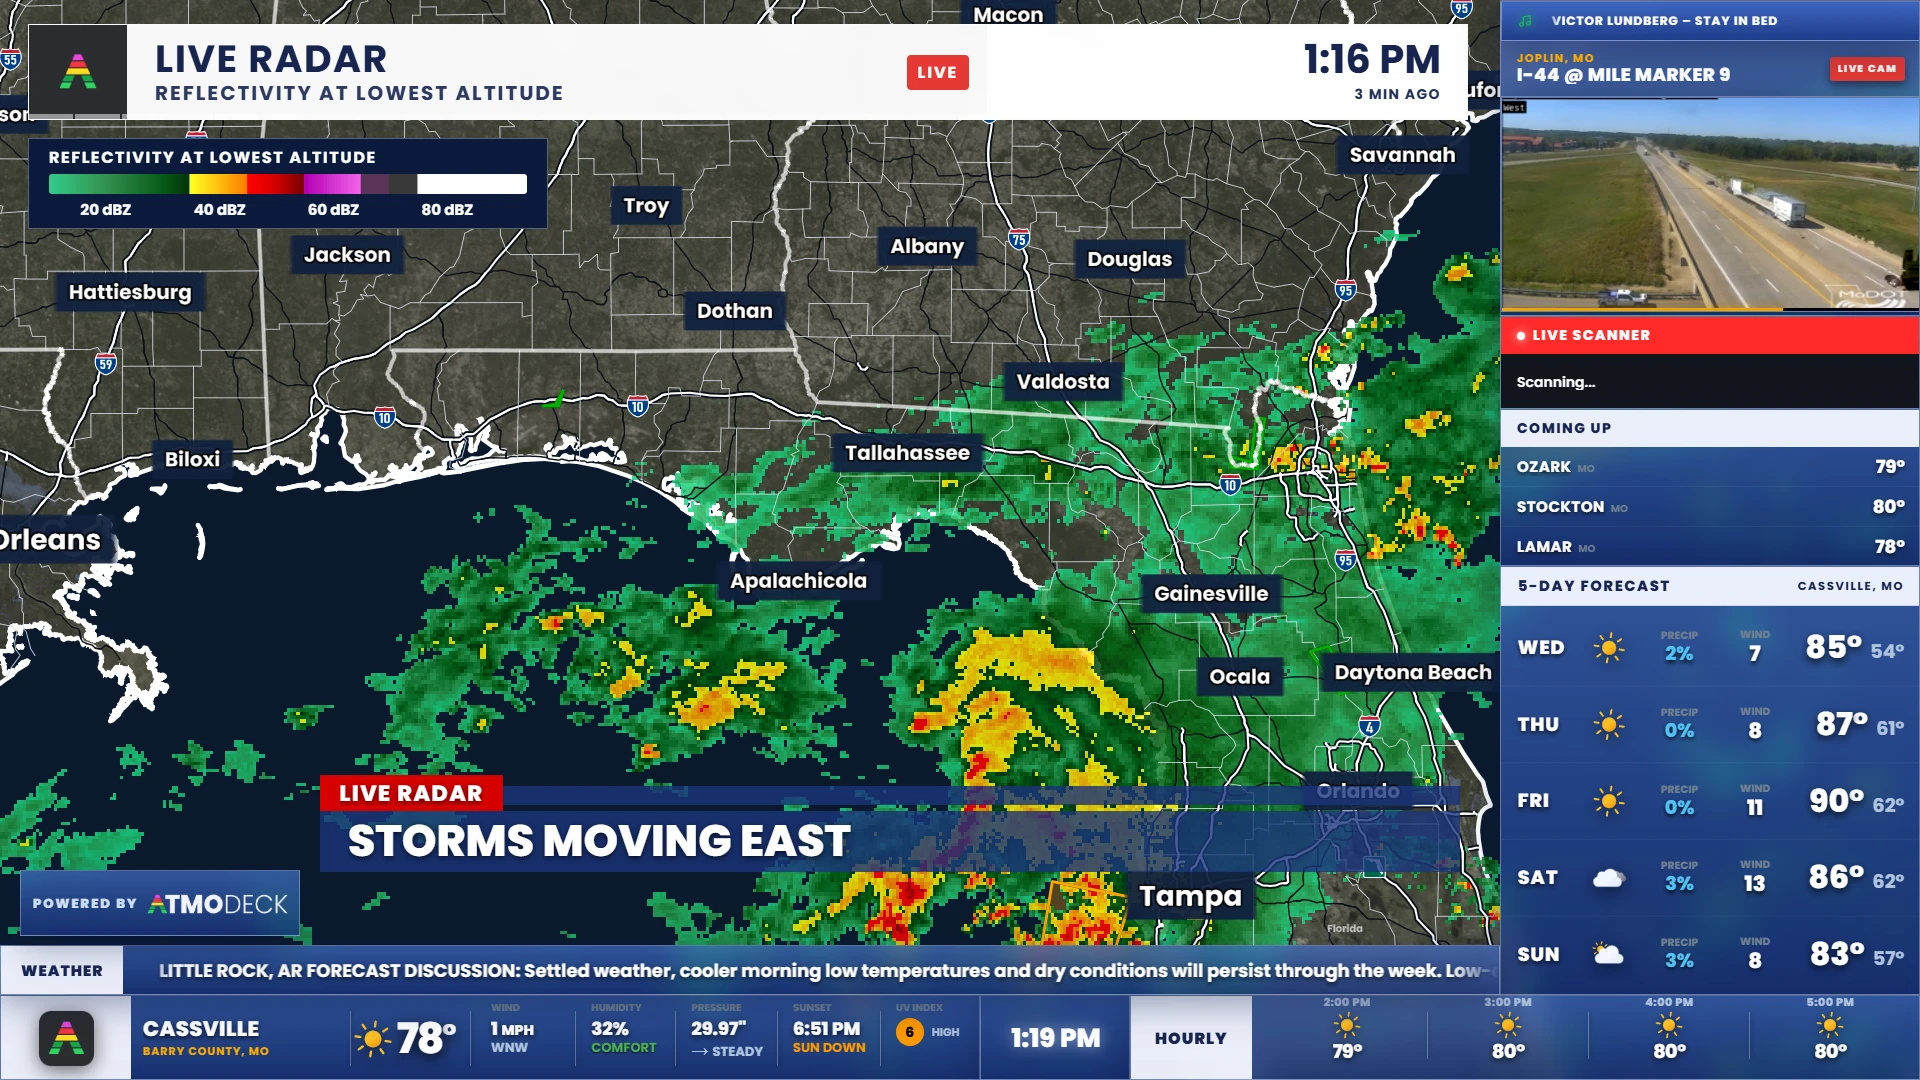
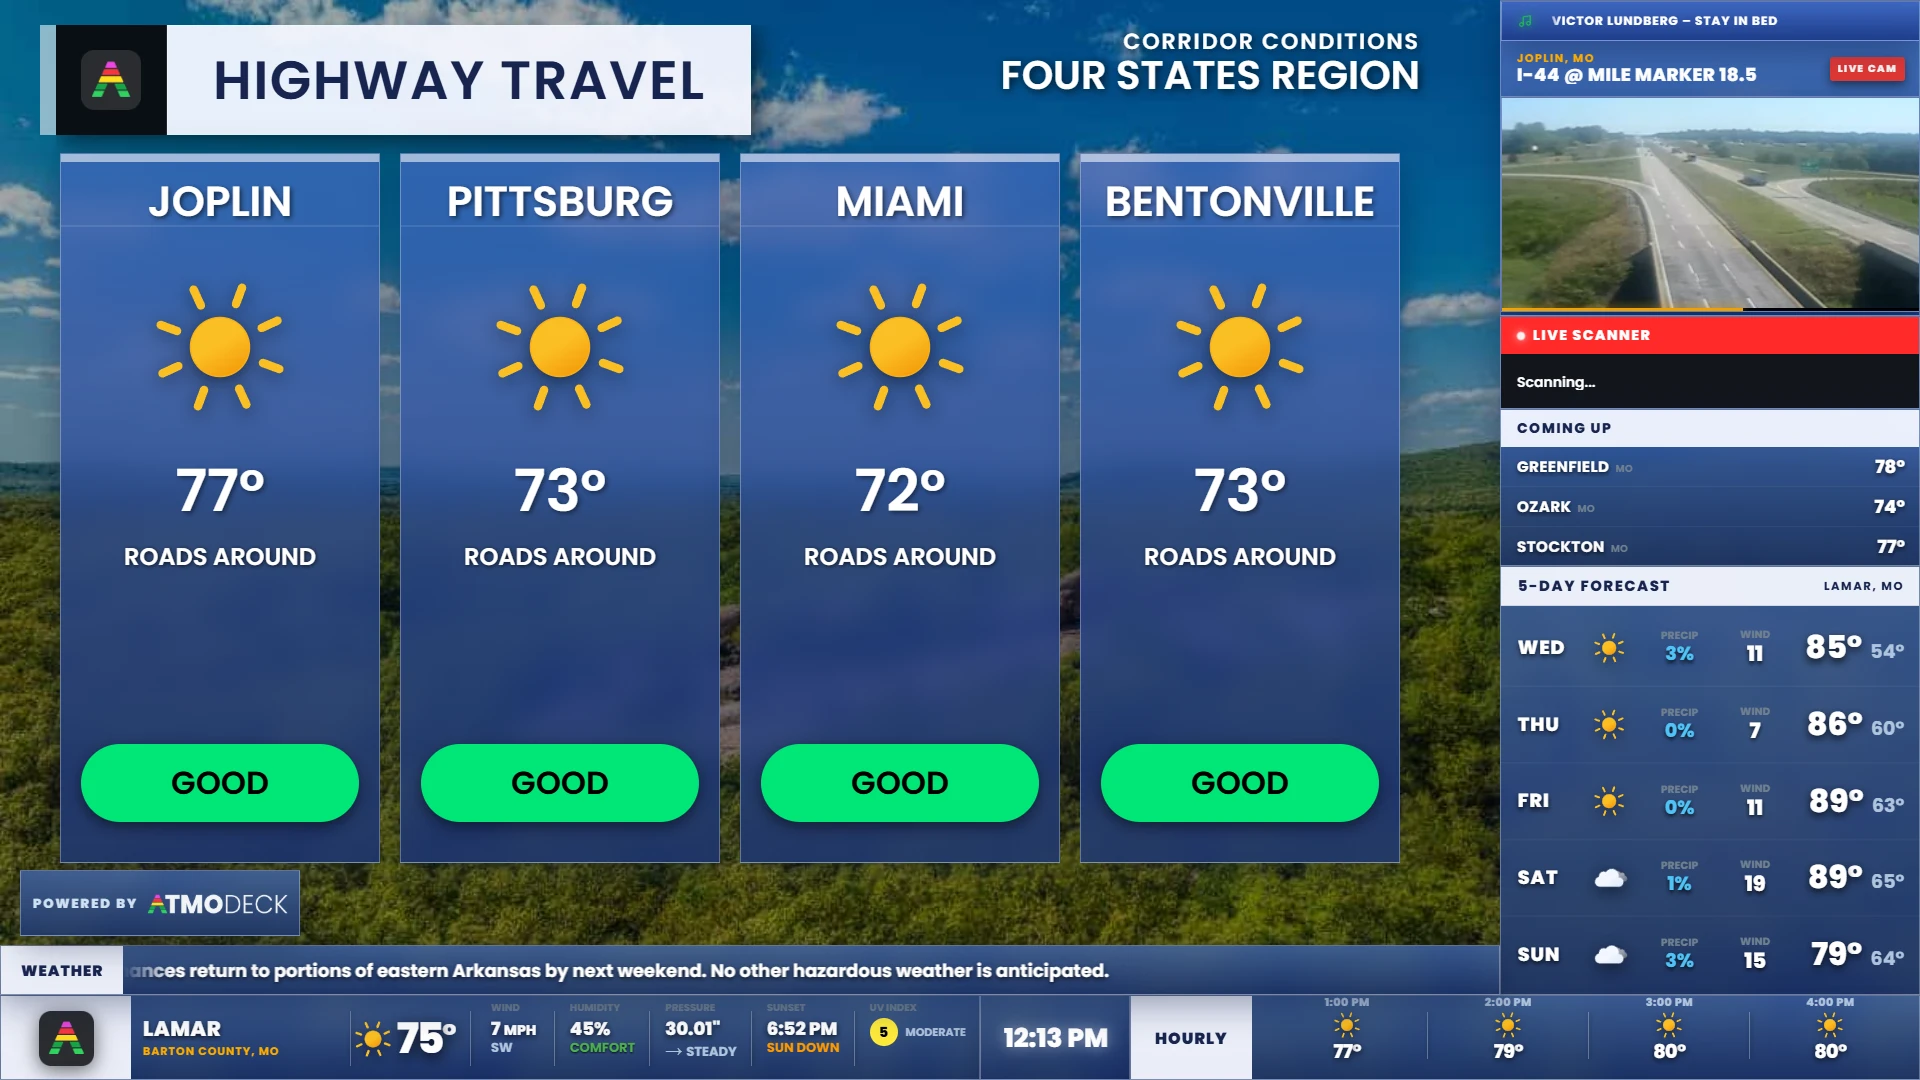
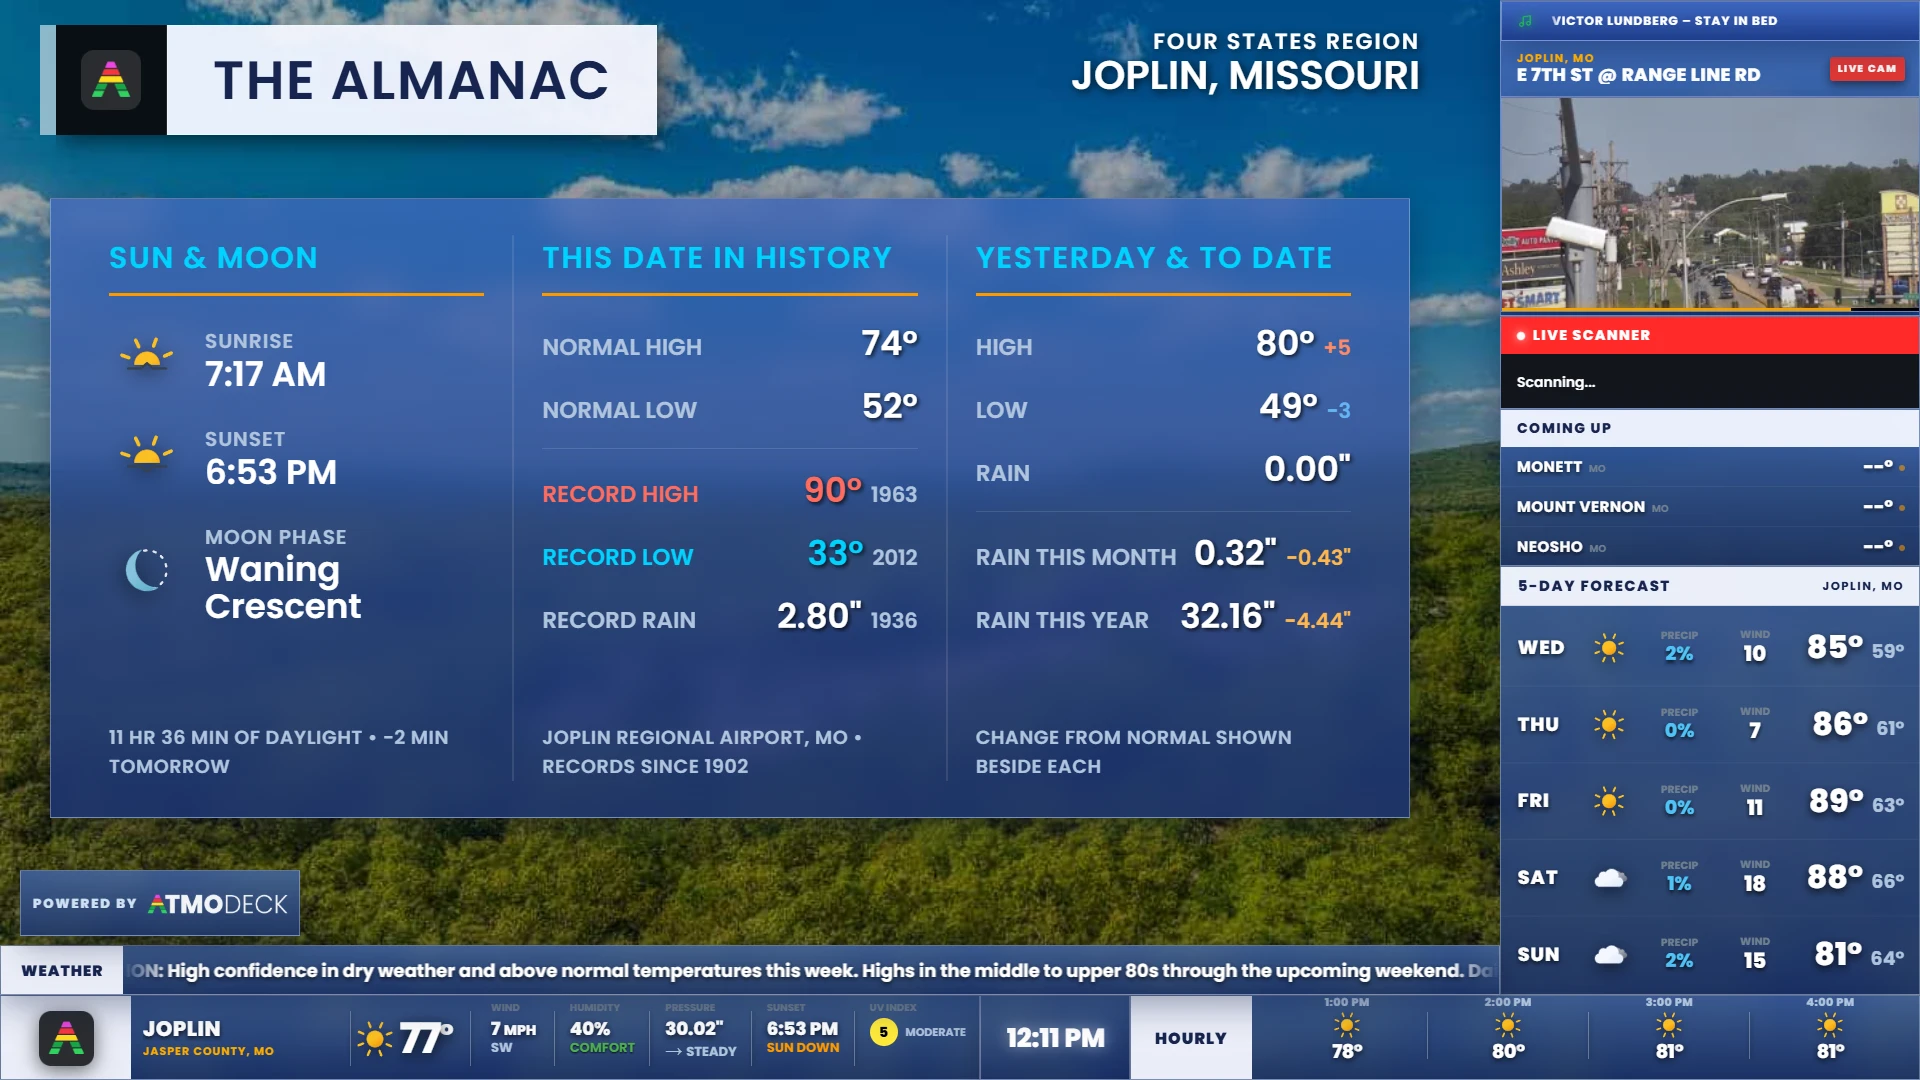
The on-air package. A bottom bar with the current conditions, a clock and the hourly forecast; a sidebar with a live camera, a scanner line, the temperatures of the next cities and a multi-day forecast; a scrolling ticker; and severe weather graphics that take over by themselves when the National Weather Service issues an alert for your area.
43 widgets you can place anywhere, resize, switch off and restyle: radar, watches, storm reports, air quality, space weather, earthquakes, wildfires, your own weather station, sponsors, countdowns and more (section 8.1). Saved layouts and starter layouts change the whole arrangement in one click.
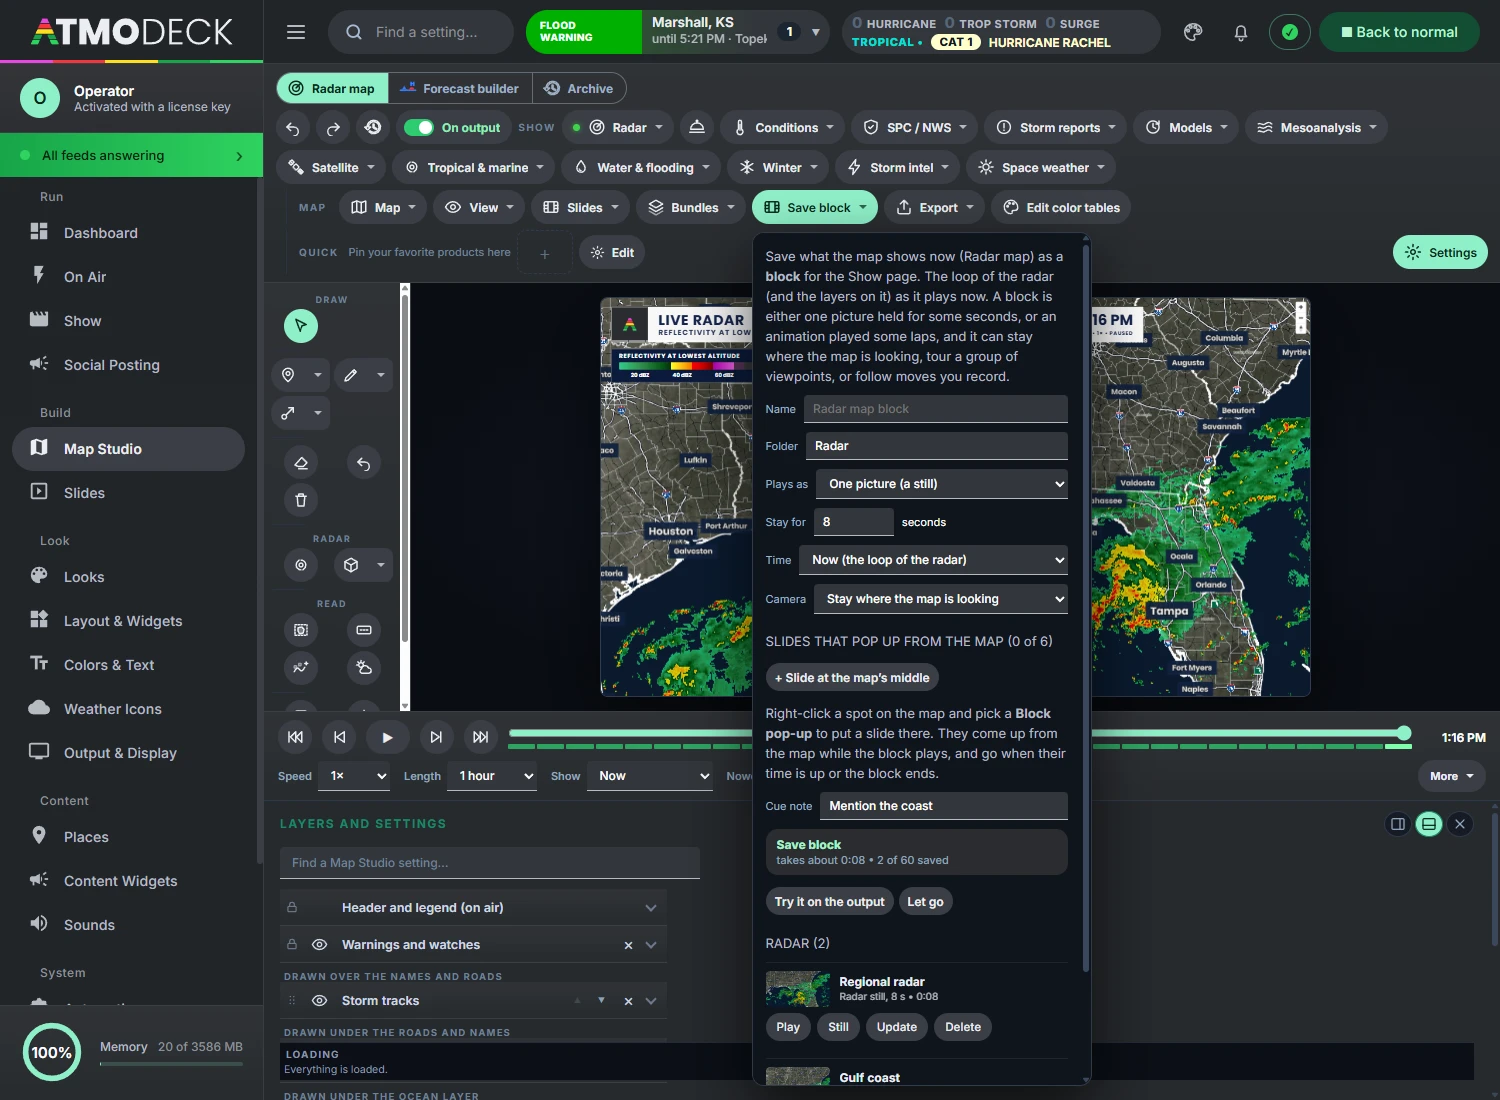
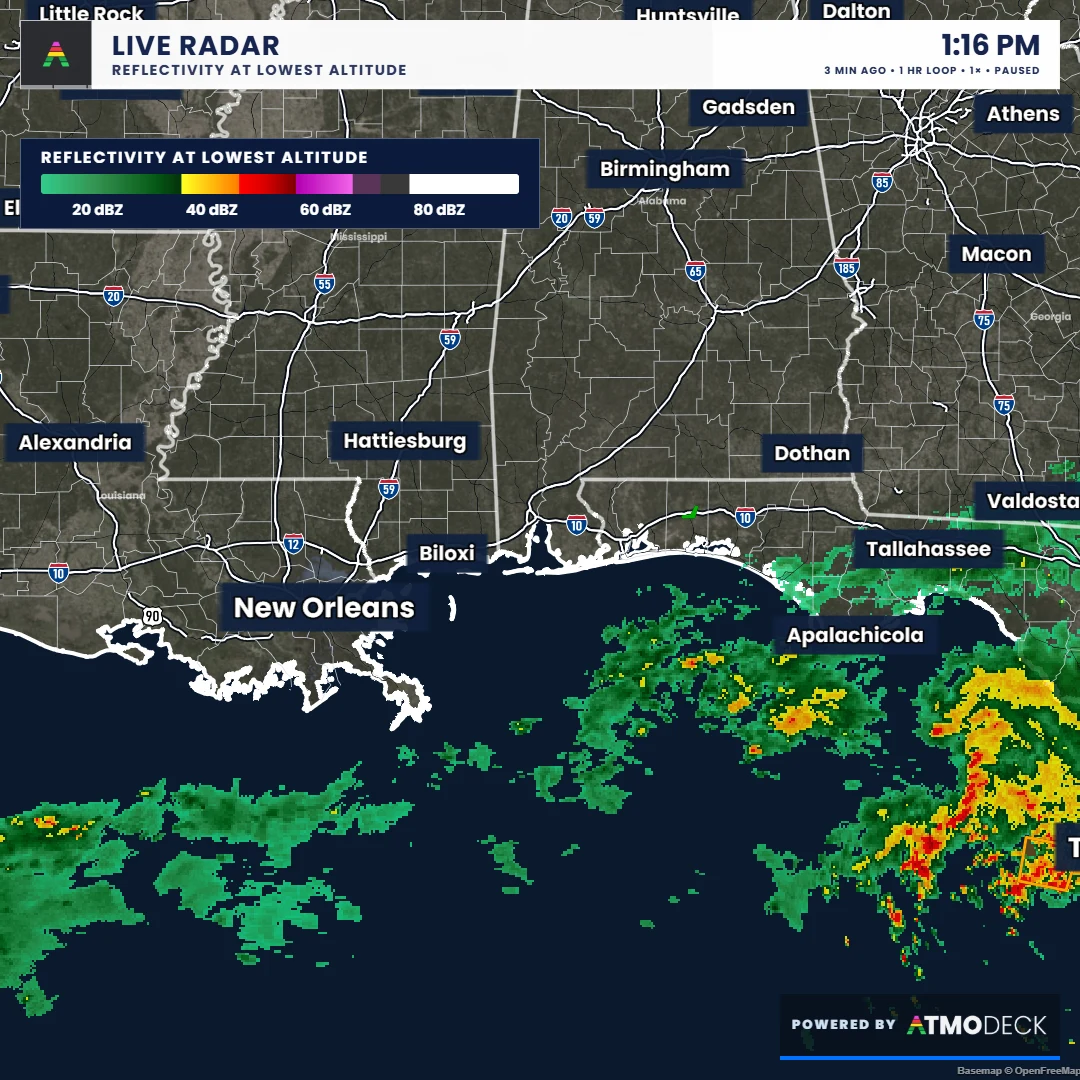
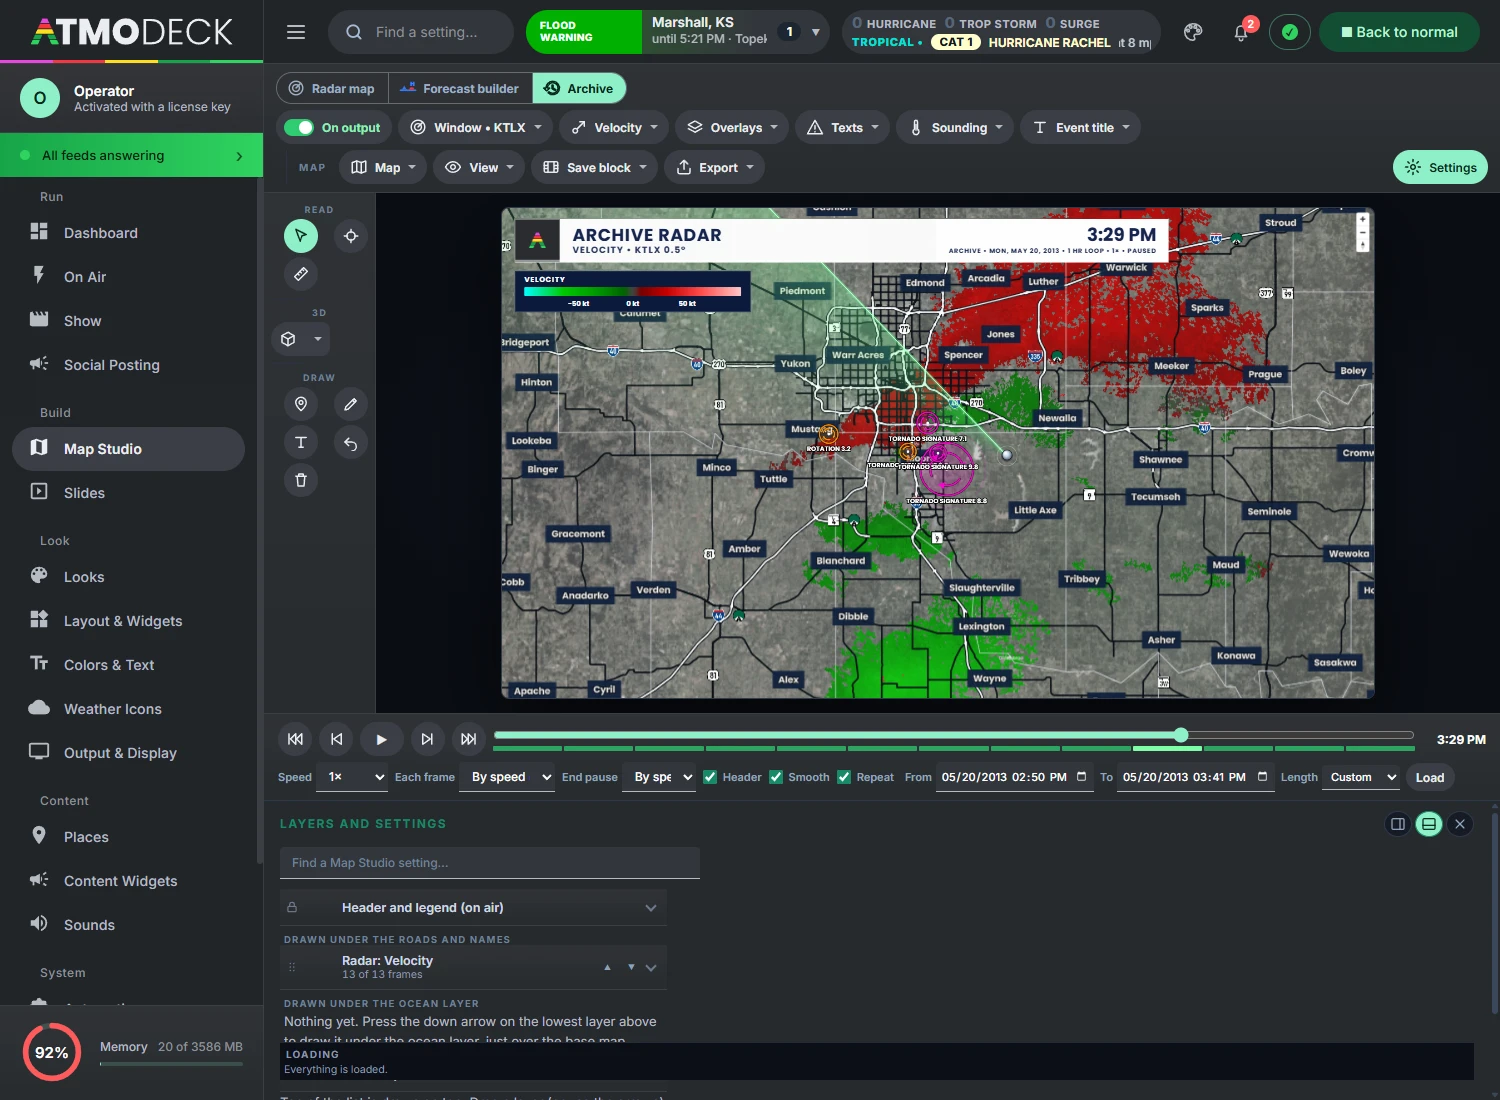
Map Studio, a radar map studio behind the widgets: live NEXRAD radar decoded on your own computer, national radar, satellite, forecast models, hurricanes, 3D, tools to draw and measure, and an archive of past storms (chapter 18).
Slides and shows. Full-screen forecast slides as steps of a show (chapter 14), and a Show page that lines up map blocks, slides and intros like a broadcast rundown (chapter 13).
Alert posting. Each new watch and warning goes out, with a picture of the area, to X, Bluesky, Mastodon, Facebook, Telegram, Discord, Slack, Teams or any web address (chapter 12).
Automation. OBS scene switching, Twitch chat requests, scheduled actions, and a remote page for your phone or a Stream Deck (chapter 16).
AtmoDeck is built for the United States and Canada. In the United States, alerts, storm reports and forecast offices come from the National Weather Service and the area you watch is made of counties. In Canada, alerts and radar come from Environment and Climate Change Canada and the area is made of forecast zones (section 6.2).
Not an official warning system. AtmoDeck shows public weather data and tools made from it for a presenter. Rotation markers, outlooks of its own and the other computed products are aids, not warnings: keep using official channels for safety decisions.
1.2 The two windows
AtmoDeck opens two windows, and understanding the difference makes everything else easier.
The Output window is what your audience sees. It is a frameless, transparent window with a fixed 1920 by 1080 broadcast canvas (or 1080 by 1920 if you choose the vertical shape, see section 8.9). This is the window you capture in OBS, vMix or your encoder. It has no menus or buttons.
The Console window is where you operate the software. It has a menu of pages in three groups (chapter 5), including Map Studio for the radar map (chapter 18). Nothing you do in the Console needs the Output window to be focused.
Settings you change in the Console apply to the Output window immediately. Most changes save automatically or when you press the panel's Apply button.
1.3 How this guide is organized
The guide follows the order you will meet things in. Part 1 gets AtmoDeck installed and on screen. Part 2 makes it yours: your area, your colors and logo, the layout of the widgets. Part 3 is running a broadcast: the On Air page, severe weather, posting, shows, slides and automation. Part 4 is the weather map (Map Studio), the biggest part. Part 5 is keeping everything healthy, backed up and up to date, and Part 6 is quick reference.
If you know what you want to do but not where it is, start with chapter 2: everyday tasks, each with a link. Chapters and sections are numbered, every mention of another section is a link, and the names in bold are the names on the buttons and pages of the program.
The search box above the contents looks through every word of the guide and lists the sections that have all your words. Long sections show their first part and fold the rest under More detail; a link or a search result that leads into the fold opens it.
2. Find it fast: everyday tasks
Pick what you want to do and follow the link. To look for something else, type in the Search the guide box above the contents: it searches every word of the guide, not only the headings. Inside AtmoDeck, F1 opens the same guide with the same search.
AtmoDeck runs on Windows. Map Studio includes Live Map and Archive, all their available weather products, photo and video exports, legends and alerts, and a glass header with adjustable colors, text and logo. Forecast Builder and broadcast production tools are included in Solo, Standard and Pro.
3.1 Installing and activating your license
Start a 7-day free trial (or subscribe) on the pricing page. Your license key is emailed to the address you used (check spam if it does not arrive within a few minutes).
Download and install AtmoDeck from the download page on the machine that will run the broadcast.
On first launch an activation screen asks for your key. Enter it exactly as emailed, in the form ATMO-XXXX-XXXX-XXXX.
The machine is now activated. Map Studio activates one computer with Live Map and Archive, exports, legends, alerts and the glass header. Solo, Standard and Pro include the full broadcast suite on 1, 3 and 6 computers respectively.
Offline and payment grace. AtmoDeck checks your license when it starts and again every few hours while it runs. If the internet drops, it keeps working until the license lease from the last successful check runs out, which is up to 24 hours. If a card payment fails, the license keeps working for 5 days while payment is retried. A canceled subscription stops working at the next check.
To see which machines are using your key, free a slot after replacing a PC, view invoices, or manage your subscription, open the account page. Sign in with the email on your subscription using a one-time code or magic link; the legacy license-key tools remain available below the account sign-in.
3.2 Map Studio or Full AtmoDeck: what your plan opens
One installer serves both editions, and your license decides what opens.
Map Studio (one computer): Live Map and Archive with every weather product they offer, photo and video exports, legends and alerts, and the glass header with colors, text and logo you can change. The Console opens straight on Map Studio, and its menu has Map Studio, Keybinds, Status & Health and Keys & Backup. There is no Places page: the cities, counties and cameras belong to the broadcast widgets.
Full AtmoDeck (Solo, Standard and Pro: 1, 3 and 6 computers): everything in Map Studio, plus Forecast Builder, the on-air widgets and layouts, the slides, the Show page, Voice and the Teleprompter, Social Posting, automation and the Team page. The three plans have the same features, with one difference: Standard and Pro can switch the Powered by AtmoDeck badge off (section 8.3).
This guide covers both. The chapters of Part 4 (Map Studio) and Part 5 apply to everyone; Parts 2 and 3 describe the broadcast suite. A tool that belongs to the full version says so in the program where it would appear.
3.3 Choosing the drive to install on
Run AtmoDeckSetup-ChooseDrive.exe and it asks which drive AtmoDeck should go on: any NTFS drive in the computer is listed with its free space (the system drive is the usual place). AtmoDeck needs about 1.5 GB, and the radar it downloads is kept there too, so a fast drive such as an SSD is best. On another drive the program is put in AtmoDeck at the top of the drive, and every update goes there as well. If AtmoDeck is already installed the setup updates that copy where it is; to move it, remove it first (Settings > Apps) and run the setup again. Where it is installed makes no difference to how it runs, apart from the speed of the drive.
4. Your first setup
A new install is two things away from being on air: the area you cover, and the Output in your streaming software.
4.1 The setup wizard and the checklist
The first time AtmoDeck opens, the Console starts a setup wizard with three steps. It fills in your counties (or forecast zones), your cities, your area name and, if you like, a camera.
Step 1, Where are you? Type your city and state or a ZIP code. In Canada, type your city and province (for example Winnipeg, MB).
Step 2, How much area? Choose Whole county (just your county), Nearby (about 30 miles), Regional (about 60 miles), Wide area (about 100 miles) or Whole state (every county of the state). In Canada the choices are Whole zone, 25, 60 or 100 kilometres, and Whole province (every forecast zone of the province).
Step 3, Review. Untick anything you do not want. Press the button to finish.
A whole state or province watches every county or zone in it for alerts, so nothing in your state is missed; the forecast towns that rotate on the bottom bar are taken from the nearest thirty of them, and the saved list can hold up to 260 counties. You can change all of this later.
Run the wizard again whenever you like from Status & Health > Setup wizard or from Places > Counties. It replaces your counties, cities and cameras, so export a backup first (section 26.5) if you changed any of them by hand.
Or set things up by hand
In Places > Counties, add the counties you want to watch (section 6.1).
In Places > Cities, add the cities that rotate on the bottom bar and the sidebar (section 6.3).
In Places > Webcams, add your camera links (section 6.4).
In Look > Logos, add your station logo (section 7.2).
In Keys & Backup > API Keys, add keys if you want them. Read the API guide first, especially the note about commercial use of the free weather service (section 26.3).
Getting started checklist. Until the basics are done, a short checklist sits at the top of On Air: set your area, add a logo and a camera, turn on or move a widget, save a layout. Its items tick themselves and you can hide it; Show the get-ready checklist again (Status & Health > Setup wizard) brings it back.
4.2 Capturing the Output in OBS and other software
Add the Output window to your streaming or production software as a window capture. A few things to know:
Pick the right window. The two windows have different titles: the on-air window is AtmoDeck Output and the operator window is AtmoDeck Console. In OBS, add a Window Capture source and choose the one titled AtmoDeck Output, so the Console never appears on air.
The Output window is slightly larger than 1920 by 1080 (1940 by 1100). It has a bright green border, 10 pixels wide, around the broadcast canvas. This is an on-screen edge guide, showing you where the safe edge of the picture is while you arrange widgets. Crop 10 pixels from each side in your capture software so the border does not go on air. In OBS, use the Crop/Pad filter with 10 on all four sides.
The window is transparent. If your capture source has a transparency option (for example, allow transparency on a window capture), turn it on to overlay AtmoDeck on top of other video.
Everything inside the border is exactly 1920 by 1080, so a 1080p canvas needs no scaling.
You can close the Output window from the Console or the application menu; there is no close button on it.
Tip. Position the Output window on a monitor by itself so the Console and your other tools never cover it while it is being captured.
4.3 Ready for air: quick setups and Go live
The Dashboard has a Ready for air card with two jobs: put the map and the layers the way a kind of day needs them, and check that everything is ready before you go on.
Quick setups. One click sets the radar, the warnings and the layers for Severe weather, Winter weather, Tropical, Flooding or an Everyday forecast.
The self-check. A few plain words say how the radar, the Output, the internet and your license are doing. Anything wrong is listed first.
Go live. Checks everything, makes sure the map is on the Output, and starts the show chosen on the Show page (section 13.5). If the check found a problem, it lists it and asks before it goes on.
The same quick setups and Go live are in the command palette (Ctrl + K).
5. A tour of the Console
The Console is the window you operate AtmoDeck from: a menu of pages on the left and a top bar of the tools you always want.
5.1 The pages of the Console
The Console is a wide window (it opens at 1280 by 1080 and can be made smaller; it then switches to a compact layout). A menu on the left lists its pages in three groups, and a top bar holds the tools you always want (section 5.2). A page with several parts has tabs along its top.
Weather is always open, and the Console opens on its first page, the Weather map. Broadcast and Setup fold: click a group’s name to open or close it, and it stays as you left it. The search box at the top of the menu finds every page and setting.
Group
Page
What it is for
Weather
Weather map
Map Studio, the radar map: Live Map, Forecast Builder and Archive, with the top bar, the tool rail, the preview, the play bar and Active layers (chapter 18).
Dashboard
The alerts and radars at a glance, headlines for your area, the day’s severe chances, the data feeds and the Ready for air card (section 5.4).
Space Weather
The Sun, flares, the solar wind, the aurora, the Moon and the sky (section 21.9).
Earth & Quakes
Earthquakes, volcanoes and tsunamis on a globe, in a block of ground, in a section and on a seismogram (section 21.10).
Webcams
Every public camera AtmoDeck can find, on one map, to watch or put on air (section 6.5).
Broadcast
On Air
What you use while on air or rehearsing: saved-layout and saved-look buttons, alert color presets, forced day or night, the severe rehearsal, weather overrides, the headline for the ticker and the lower third, and the threat simulators (chapter 10).
Show
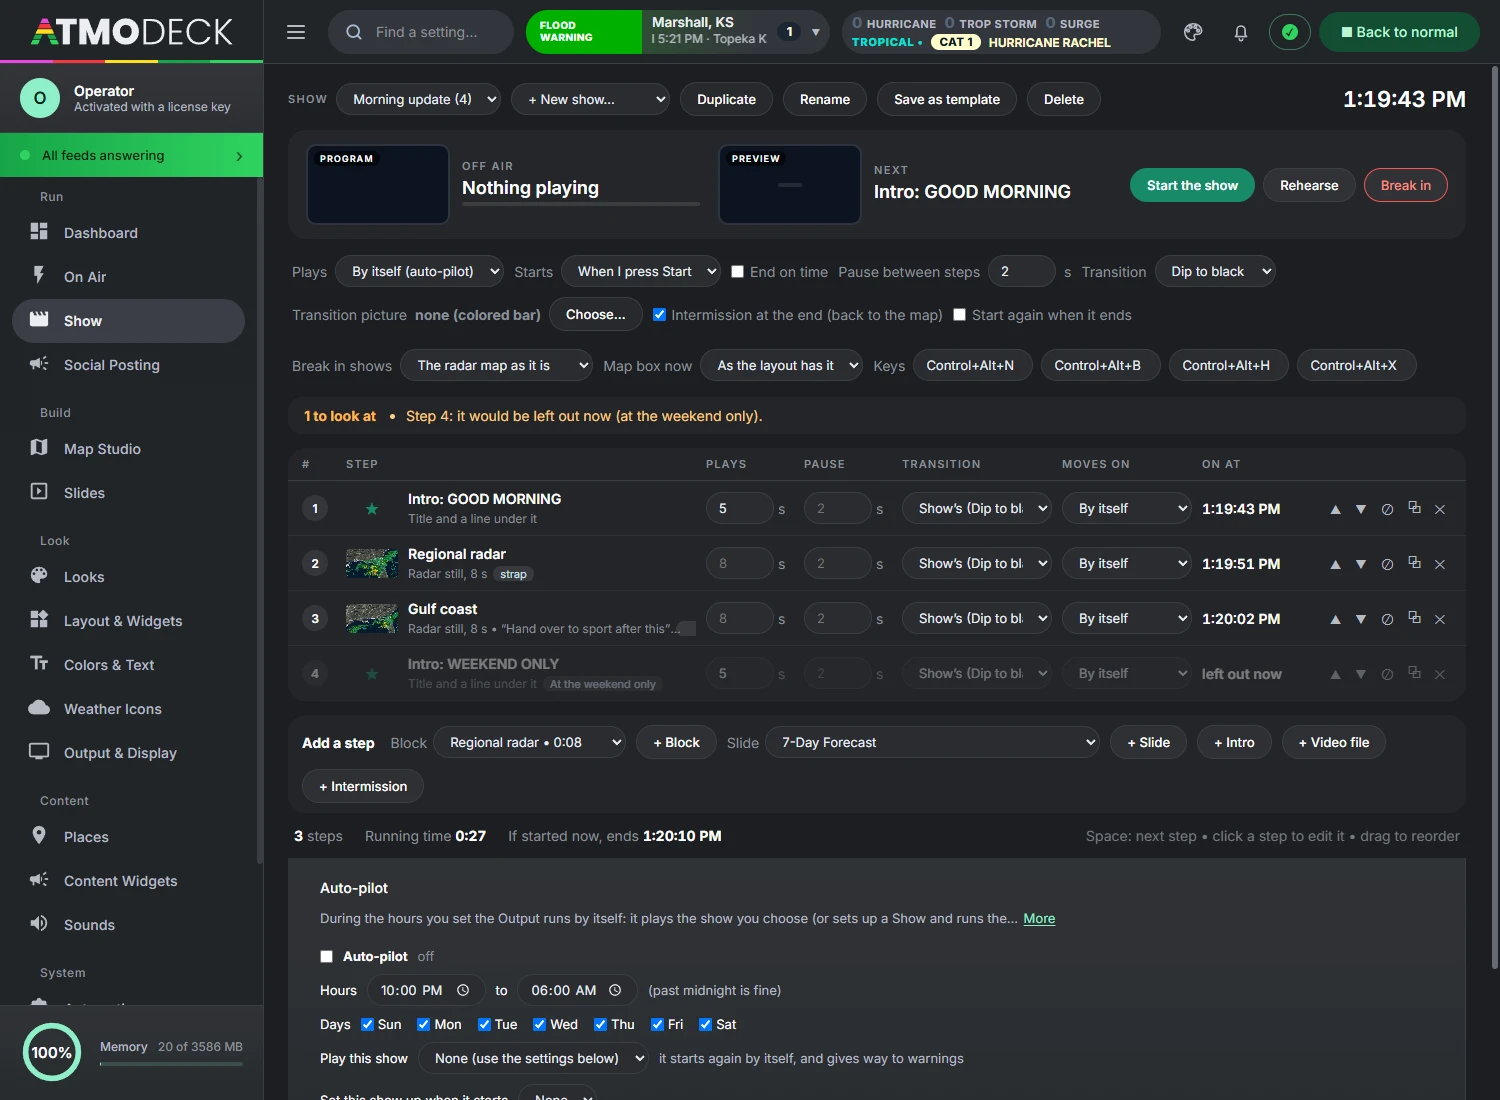
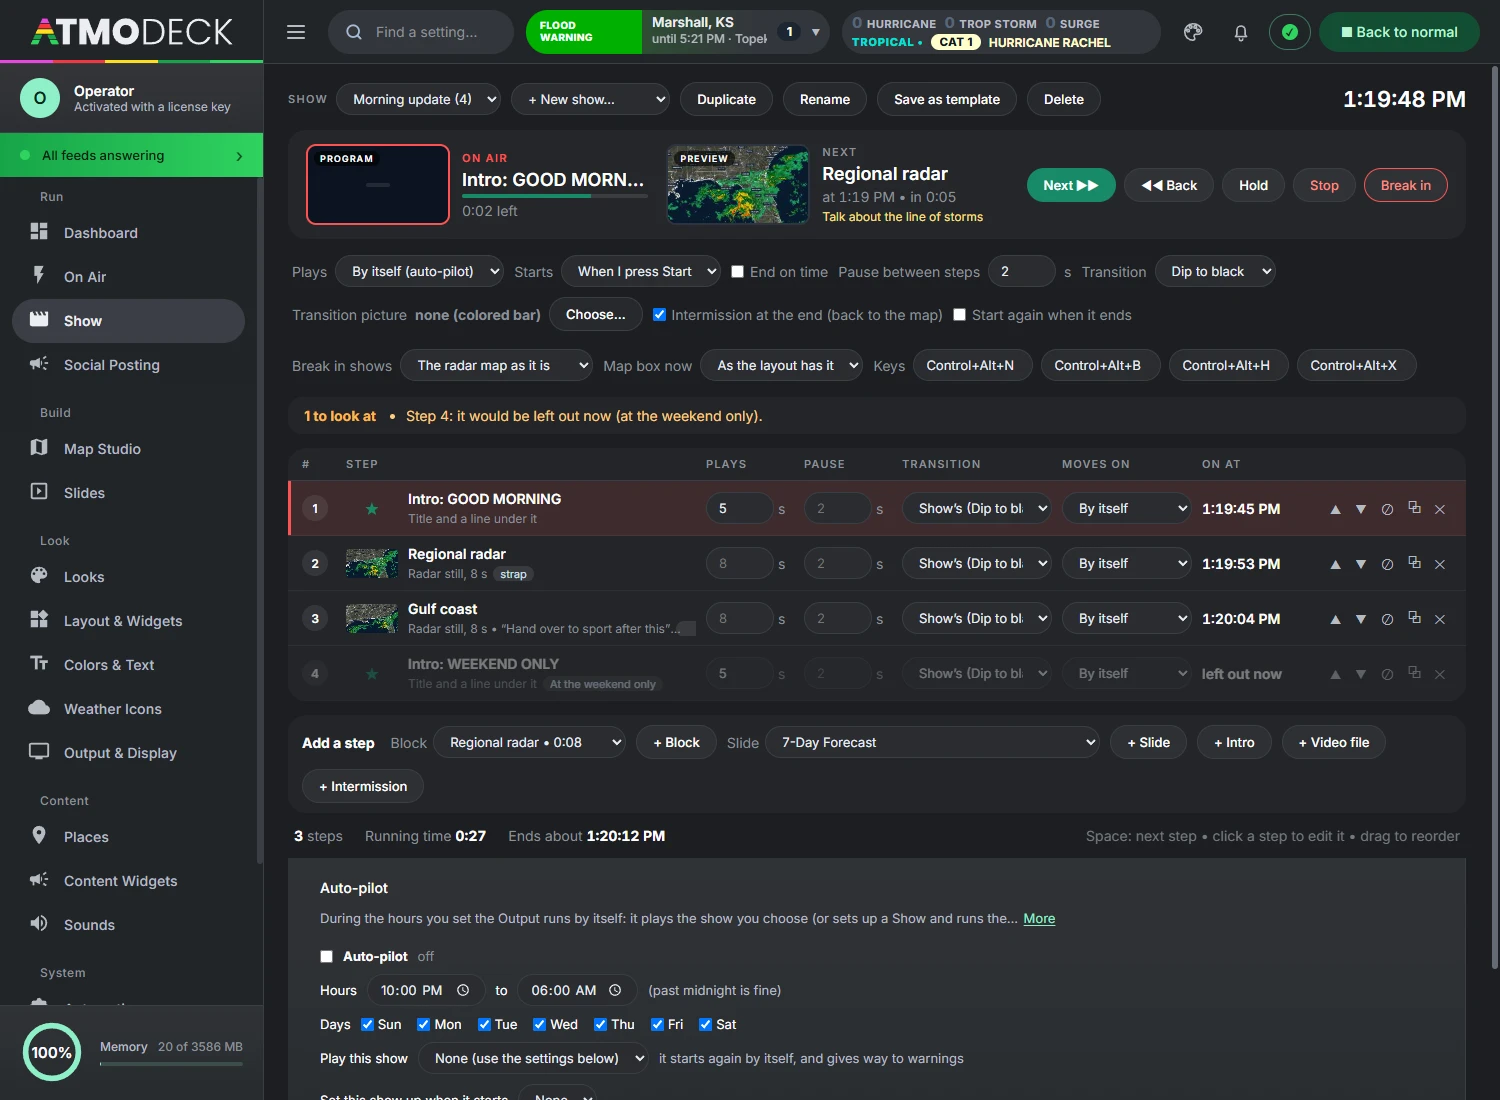
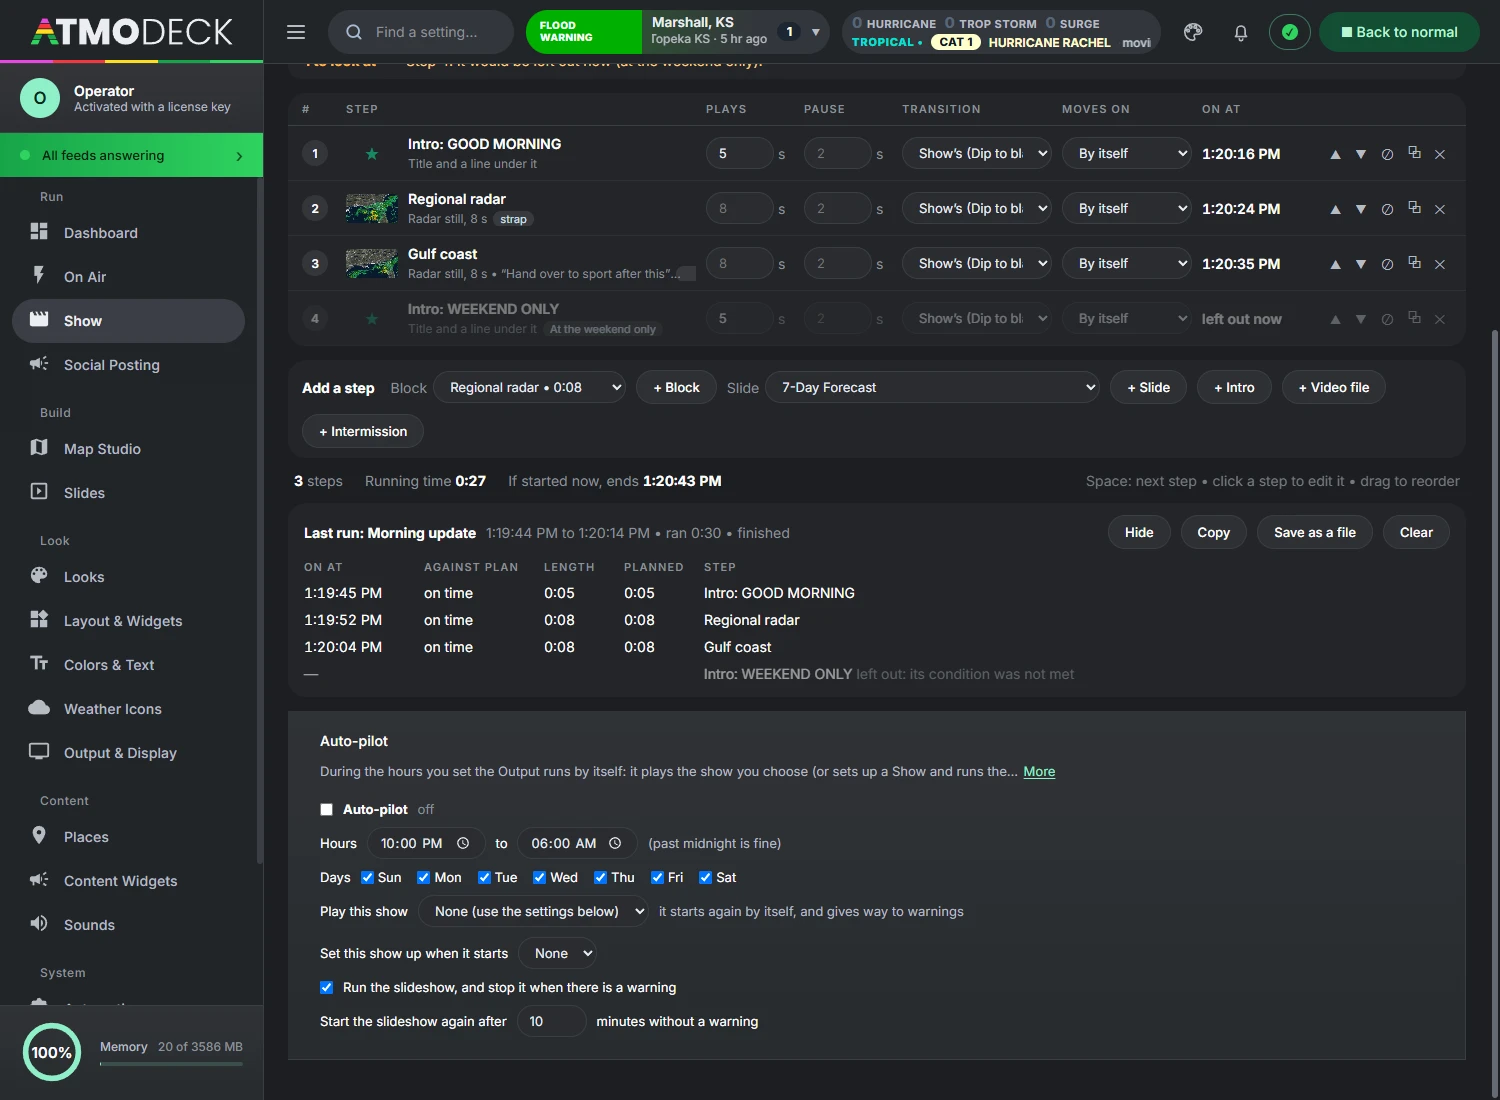
The rundown of a broadcast: map blocks, slides, intros and intermissions in order, played by the clock or step by step (chapter 13). Voice (section 15.1) and the Teleprompter (section 15.2) are folds at the foot of this page.
Slide Setup
What every forecast slide shares: location, background, data period, overrides and Look (section 14.3).
Social Posting
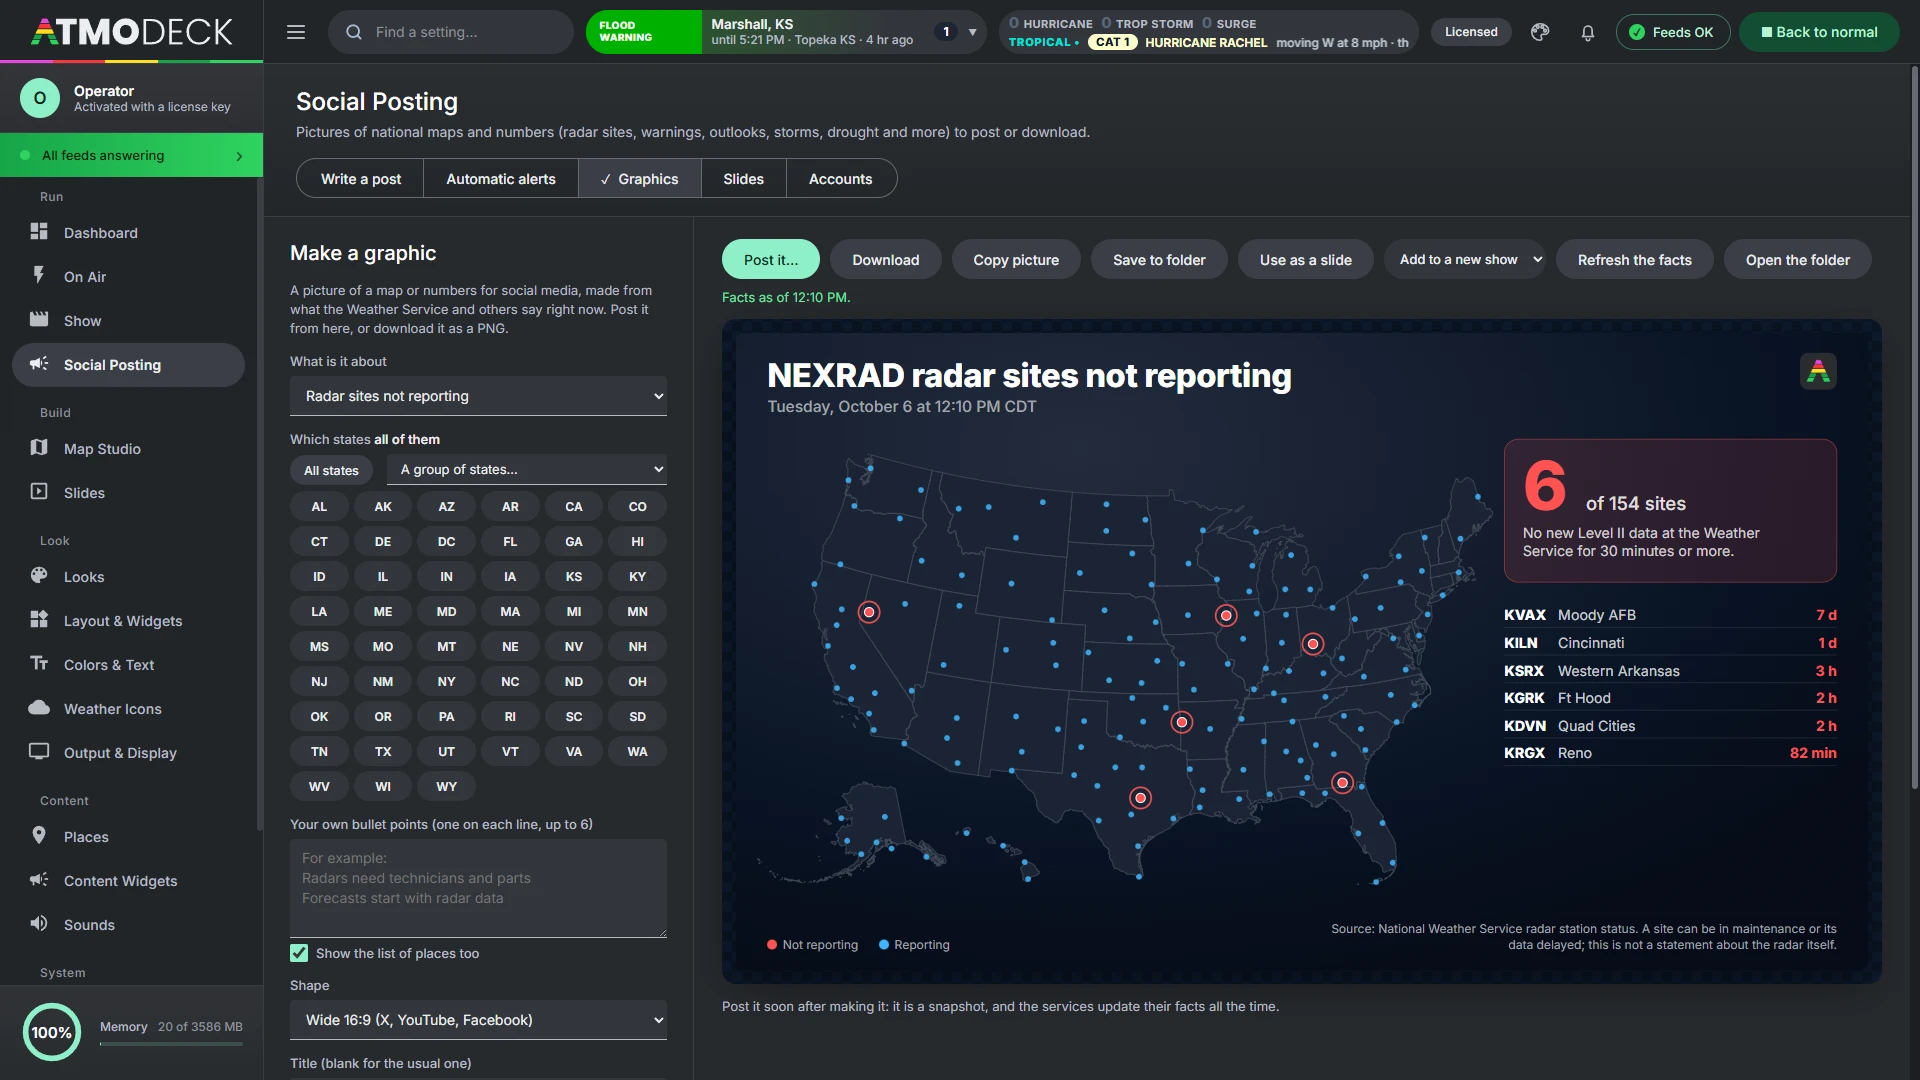
Write a post, Automatic alerts, Graphics, Slides and Accounts (chapter 12).
Where the sound goes, the volume, background music and its playlists, the equalizer, ducking, the startup sound and the severe alarm (section 11.4, section 11.5).
With a Map Studio plan the menu is shorter: the Weather map and the Dashboard, with Keybinds, Status & Health and Keys & Backup (section 3.2).
5.2 The top bar
Find a setting. Press Ctrl + K, or click the box, and type. The search covers every page, tab and setting; pick a result and the Console goes straight to it. Type a product (dew point, velocity ...) and pick Product: ... and the map shows it in Map Studio. Map Studio has its own search at the top of Active layers (Find a Map Studio setting).
The alert box (the left of the weather card in the middle of the bar). The alert issued last, in its own color, with the event, place, expiry and hail, wind or tornado tags. A chime plays for a new one (urgent for a tornado warning); an upgraded alert counts as new, a code you have already heard does not repeat. Click it to drop down every current alert, nationwide or in your area; when several alerts were issued within two minutes of the newest, the most severe is the one shown.
The threat block (the right of the same card). Counts of tornado, severe thunderstorm and flood warnings, the highest SPC outlook of the day with the highest tornado, hail and wind chance and the regions it covers, storm reports so far, tomorrow's category, and little day boxes whenever the product reaches past today, so you can see which day it is on and click straight to another. Switch it to flash flood, winter, fire weather or heat.
The status light. Green when every data feed is answering. Click it to open Status & Health.
Back to normal. Clears forced themes, rehearsal alerts and overrides and returns to normal automatic operation (the same as Reset Everything).
Most pages have a row of small buttons under the title that jump to a section of a long page, and the Apply and Reset bars stay in reach as you scroll.
5.3 The command palette, the bell, Console themes and desk notes
Four small things in the Console that save time every day.
The command palette (Ctrl + K). One box that finds and runs things: pages and their tabs, any setting, shows, layouts, viewpoints, map slides, layer switches, a product by name, and actions such as undo, demo mode, Go live, Next in the show and pausing the team sync.
The bell. It lists announcements from AtmoDeck, updates, payment and account notices, a data source that stops answering, a freeze, the alert types you asked the Dashboard to tell you about, and the towns of Unwarned in the path (section 20.10). Opening it marks them read, each one opens the page it is about, and Windows notifications can be switched on there.
Console themes. The palette button beside the bell changes the colors of the Console itself: Ocean, Graphite, Black, Slate, Forest, Teal, Violet, Ember and Crimson. Map Studio's buttons follow it; the Output, the broadcast and the map keep their own colors. The choice is kept on this computer.
Desk notes. A card on the Dashboard for notes to yourself or the next shift. They are shared with the phone remote page, and when the computer is on a team the card becomes a live chat (section 26.6).
Your account is under the name at the top of the menu: the plan, the computers using the license, invoices, the card and signing out.
5.4 The Dashboard
The Dashboard is the page the Console opens on, and the one a weather presenter looks at first. It only reads what the Console already holds and draws it; nothing on it changes a setting, except the Ready for air card (section 4.3).
The chart band. How the warnings and watches in effect run over the hours round this moment. Choose how far either side it looks.
Headlines. What matters for the area you chose: the alerts in effect, the Storm Prediction Center's outlook at your place, the forecast discussion and your news feeds. A search box and a type filter narrow them, a pin keeps one, and you can ask to be told (in the bell) when a type of alert or a product appears.
The outlook dial. The day's chances as a dial: tornado, wind and hail for severe storms, swapping to flash flooding or winter when that is the bigger threat (or when you pick it). Click a day box to see another day.
Announcements. Messages from AtmoDeck, shown on every Dashboard.
The table. The active alerts, radars that are down and today's storm reports, with the data feeds and what was issued today beside it.
Ready for air. Quick setups, the self-check and Go live.
5.5 The Dashboard of the Map Studio edition
The Map Studio edition has a Dashboard of its own, first in the menu: the full edition's Dashboard (section 5.4) with the cards of the broadcast left off.
It has: the alert activity chart, the headlines (alerts, storm reports and Weather Service products), the outlook dial, announcements, the table of alerts, radars that are down and storm reports, the data feeds, and Today.
It does not have: the readiness check for a broadcast, the first-run list, the show and run of show, or the desk notes.
Open Map Studio, under Today, goes to the map.
The Console still opens on Map Studio; the Dashboard is one click away in the menu.
5.6 Help: the guide inside AtmoDeck, with search
The round ? button at the top right of the Console, after the Feeds pill, opens Help: this whole guide, inside AtmoDeck, with no internet needed. F1 opens it too, and so does Open help and the documentation in Ctrl+K. Esc or the ✕ closes it.
Search. Type in the box at the top: every part of the guide that has all your words is listed, best match first, with the words marked in a short piece of the text. Pick one to read it. Searching is by words, so a setting’s name, a page’s name or a thing you want to do all work.
Contents. The list on the left has every chapter; the chapter you are in opens to show its sections. The arrows at the foot of a part go to the one before and the one after.
Links. A link to another part of the guide opens it in Help. A link to a web page is shown as plain text, since Help works without a connection.
Where it opens. The first time, Help starts at the part of the guide for the page of the Console you are on (Voice opens at Voice and the teleprompter, Map Studio at the Map Studio chapters). After that it opens where you left it, until you restart AtmoDeck.
Help is the same text as the documentation on the website, made from it for every new version of AtmoDeck.
Part 2Set up your station
Tell AtmoDeck where you are, make it look like your station, and arrange what is on the screen.
6. Your area and your places
Your area drives everything local: which alerts are shown, which storm reports and forecast offices are used, which cities rotate on the bottom bar and which cameras play.
6.1 Choosing your area (Counties)
The counties you list in Places > Counties define the entire monitored area. One list drives all of this:
Alerts shown on air are only those that affect your counties.
The alert mini map draws only your counties, zoomed to fit them.
Local storm reports and SPC mesoscale discussions are filtered to your counties and states.
NWS forecast offices (WFOs) are chosen automatically. AtmoDeck looks up which offices cover each of your counties and uses them for forecast discussions and storm reports. The chosen offices are shown at the top of the Counties screen. A large multi-state area is capped at the six offices that cover the most of your counties.
Cover a whole state. In the setup wizard, How much area? offers Whole state: every county of the state is watched for alerts, so nothing in the state is missed. The saved list can hold up to 260 counties; the forecast towns that rotate on the bottom bar are taken from the nearest thirty.
6.2 Canada
AtmoDeck works in Canada. Open Places > Counties, choose Canada in the Country box (or use the setup wizard and pick Canada), then type your city and province, like Winnipeg, MB. The wizard picks your forecast zone and the zones around it (Environment Canada's public forecast regions, which take the place of US counties), plus forecast towns for the bottom bar. It also switches to metric units (°C, km/h, hPa); change them any time in Look > Station & Text.
Alerts: Environment and Climate Change Canada weather alerts for your zones: tornado, severe thunderstorm, winter, rainfall, heat, wind and other warnings, watches, advisories and statements. They drive the alert strip, the threat panel, the alert map, the severe theme, the Watches list and the Discord alerts, the same as in the US. Alerts are shown in English. Colored warnings (yellow, orange, red) keep Environment Canada's colors unless you set your own in Look > Alert Colors.
Alert map and Radar: the alert map and the Radar draw your forecast zones. The Radar shows Environment Canada radar, Rain or Snow (right-click it), looping about six minutes per frame. Velocity, the satellite, topographic and relief map styles are US-only and are not offered in Canada.
Weather, hourly forecast, air quality, earthquakes, space weather, tropical systems and the news ticker work anywhere.
Not available for Canada yet (US data only): Storm Reports, the Severe Outlook (SPC), Drought Monitor, Wildfires, Power Outages, River & Lake Gauges and Marine & Tides. Turning one on shows a short note instead. Forecast discussions do not appear in the ticker, and the slides' alert lookup is US-only.
Storm-chaser mode works in Canada and across the border. It checks whether your phone is in the US or Canada, so the Radar switches between NEXRAD and Environment Canada radar, warnings come from both services, and the nearest-warning box on the phone uses whichever applies. With use my GPS town for everything on, the whole app follows you across the border: alerts, the severe theme, zones and towns switch to that country's service, and switch back when you stop chasing.
To change your area later, open Places > Counties: the zone list has a Remove button for each zone, and Change my area (wizard) starts over. Switching back to United States runs the wizard for a US place.
More detail: To add or change counties
To add or change counties
Open Places > Counties.
Click + Add County, choose the state, and start typing the county name. Suggestions appear as you type. Do not add the word County.
A green check means AtmoDeck found the county. An amber warning means no county by that name exists in that state; check the spelling.
Optionally enter an Area name (for example "Ozarks"). It appears in the regional slides.
Click Apply & Rebuild Map. The Output window rebuilds its map, alert filter and office list right away.
Resetting. Reset to Default restores the original four-state list and clears the area name. If you remove every county, AtmoDeck falls back to the default list rather than monitoring nothing.
Cover a whole province. In the setup wizard, How much area? offers Whole zone (just your zone) and Whole province (every forecast zone of the province). The saved list can hold up to 200 zones.
6.3 Cities
The cities in Places > Cities are the places whose weather rotates through the bottom bar, the "coming up" list and the multi-day forecast panel. Each city needs a name, a county in the form Jasper County, MO, a latitude and a longitude. Order matters: cities appear in the order listed, and a slide of several cities with none chosen uses your first ones.
Click Apply & Refresh Data after changing the list. The rotation restarts and fresh weather is fetched for the new list.
Mind your data budget. Every city is refreshed every 12 minutes. On the free weather tier the practical limit is roughly 35 to 40 cities. See the call budget in the API guide.
The speed of the rotation is set in Look > Station & Text (City Rotation Speed, in seconds).
6.4 Webcams
Cameras in Places > Webcams rotate through the live camera panel. Each has a label, a location and a link. You can paste almost any kind of link:
Link type
Example
Notes
HLS stream
https://…/playlist.m3u8
The most common traffic-camera format. Plays with a smooth crossfade between cameras.
Plays muted, without controls, sized to fill the panel. A channel's live stream works with a /channel/UC…/live link. Handle links (@name) cannot be embedded; use the video or channel ID link instead.
Vimeo
https://vimeo.com/123456
Plays muted.
MP4 or WebM file
https://…/clip.mp4
Loops muted.
Still or snapshot image
https://…/snapshot.jpg
Refreshed every 4 seconds. MJPEG streams are shown live.
Web page
https://example.com/cam.html
Shown inside the panel. A few sites use scripts that refuse to be framed and may not display.
Find webcams near my area. At the top of the Webcams tab, choose 25, 50 or 100 miles and click Find webcams. It lists public cameras near your forecast towns, nearest first, marked live video or picture, and + Add puts one in your list right away. Built in for 29 states, nine Canadian provinces and Yukon, New York City, NOAA buoys, the USGS river and volcano webcams, the national parks, and Creative Commons YouTube streams in the US and Canada. Elsewhere, paste any camera link as described here. The Webcams page shows all of them on one map (section 6.5).
More detail
A link that is not recognized as one of the above is treated as a web page. If you have an HLS stream whose address does not contain .m3u8, put hls: in front of it (for example hls:https://example.com/live/stream).
A camera you add, change or remove is kept at once, and goes to your team when this computer syncs with one (section 26.6). Apply changes and restart the rotation starts the camera panel over from the first camera. The time each camera stays up is set by Camera Rotation Speed in Look > Station & Text. Only show cameras you have the right to broadcast.
Camera names on the air. A DOT camera added from the finder goes on the air with a short name: "DM- I-235 @ MM 7.8 (KEO WAY)" becomes "I-235 @ KEO WAY". In the list, Name on the air is the name in the camera box; change it to what your viewers call the place. Small line above it is the line over the name, such as the city; a state alone is left off, and an empty line shows nothing. A camera with an empty line is kept like any other, on this computer and across the team.
6.5 The Webcams page: every camera on one map
The Webcams page (in the Weather group; Full AtmoDeck only) puts every public camera AtmoDeck can find on one map: the state traffic cameras (DOT and 511 sites), the Canadian provinces, New York City, NOAA buoys, the USGS river and volcano webcams, the national parks, and live streams on YouTube that are under a Creative Commons license.
What the marks mean. A green circle is live video; an orange square is a picture the source renews. Where two share a spot, the live one is on top. Live video and Picture in the key hide or show each kind, and the choice is kept on this computer.
Watch one. Click a camera and it plays in the map’s info box. It says Connecting to the camera… while it starts, and says so after 30 seconds if the camera is sending nothing.
+ Add to my webcams puts the camera in Places > Webcams (section 6.4), so it rotates through the camera panel on air.
Show live on output fills the Output with the camera, over whatever was on, with a badge at the top left (the camera’s name and place, and LIVE on a video). Take off output gives the Output back as it was.
Right-click a camera for Add to my webcams and Show the camera.
On air. Only put on air a camera you have the right to broadcast. The YouTube cameras are limited to Creative Commons streams for that reason.
6.6 Where alerts come from
AtmoDeck reads active alerts from the National Weather Service for every state that contains one of your counties, then keeps only those affecting your counties. It checks every two minutes, and every 45 seconds while at least one alert is active. Alerts with a storm polygon are drawn as polygons on the mini map; county-based alerts color the affected counties.
For faster alerts you can add a free NWWS-OI login in Keys & Backup > API Keys. AtmoDeck then also listens for pushed bulletins from your forecast offices and refreshes immediately when one arrives. Without it, normal polling still works. See the API guide.
6.7 Your own forecast over the forecast
Where the forecast comes from. Today and the next three days are your local Weather Service office's own forecast (the NDFD gridded forecast from api.weather.gov): its highs, tonight's low, the chances, sky, wind and weather. The days after come from the National Blend of Models. This is the forecast in the 5-day forecast, the conditions bar and the slides, so it matches what the Weather Service says for your area. Where the Blend has no station nearby, the Weather Service's days are shown alone.
The Forecast tab of the Places page lets a meteorologist put their own numbers over the forecast, so that every widget and slide says what the person on air says. The forecast comes from the National Blend of Models; a number you fill in takes its place for that day.
Choose one place, or every place, and fill in any of these for today and the six days after it: the high, the low, the sky (clear, partly cloudy, rain, snow and so on), the chance of rain and the wind.
A box left empty keeps the Blend's number, which is shown grayed in the box.
The hours of that day follow your numbers: their temperatures are stretched to your high and low, and their sky, chance of rain and wind are set.
It is saved at once, and the Output draws its widgets and slides again by itself.
7. Colors, logos and style
Everything that makes the broadcast look like yours. A look saves all of it under one name so you can switch between styles in a click.
7.1 Colors
Theme packs at the top of the Colors tab set the Day and Night colors to a seasonal or themed set in one click: Halloween, Winter Holiday, Autumn, Patriotic, Spring and Ocean. Default clears them. Alert themes keep their own colors on purpose so warnings stay recognizable, and you can fine-tune anything afterwards.
Look > Colors edits the palette of one theme at a time (Day, Night, Severe) plus Global Text Colors. Changes apply live. Use Copy Colors to copy the current theme's palette to another theme, and the reset buttons to undo changes for one theme or all of them.
Live Scanner colors. The Colors tab has three scanner colors: Live Scanner Color, Live Scanner Title Gradient (Start and End) for the title bar, and Live Scanner Bar While Transmitting, the red fill behind the text while a transmission is on the air.
Music, scanner and LIVE CAM backgrounds.Now Playing / Music Color is the music bar's line and icon, and Now Playing / Music Background, Live Scanner Background and Live Cam Tag Background (red by default) set the fill behind the music bar, the scanner text and the LIVE CAM tag, for each theme. In the Classic layout styles (section 7.6) every panel, title bar and label uses the colors set here: the Main Panel Background, the News Ticker Background, the Unified Titles, the Logo Box and these.
Colors are edited here and nowhere else. The Looks tab beside it holds the four choices of style (finish, fill, corners and edges) and your saved looks (section 7.7).
7.2 Logos
Look > Logos sets the logo in the bottom bar. Set a default, then override it for Day, Night or Severe. Paste an image address, or upload a file to store it inside the app.
The bottom bar's logo box. The box that holds your logo in the bottom bar takes the title color unless Logo box color of its own is on; then pick its color beside it, so gold title bars can sit beside a box of another color. Bottom bar logo takes a logo for that box only, in every theme; leave it empty to use the theme's logo.
7.3 Station, text and display settings
Look > Station & Text:
Station / Network Name: used as the logo's alt text.
Weather Ticker Label: the label on the weather ticker (default WEATHER).
Google Font Family: any Google Font name, for example Roboto or Oswald. Leave blank for the default (Poppins). The same font is used across the broadcast, including the map header and legend when they match the broadcast look.
City Rotation Speed and Camera Rotation Speed: seconds, from 4 to 60.
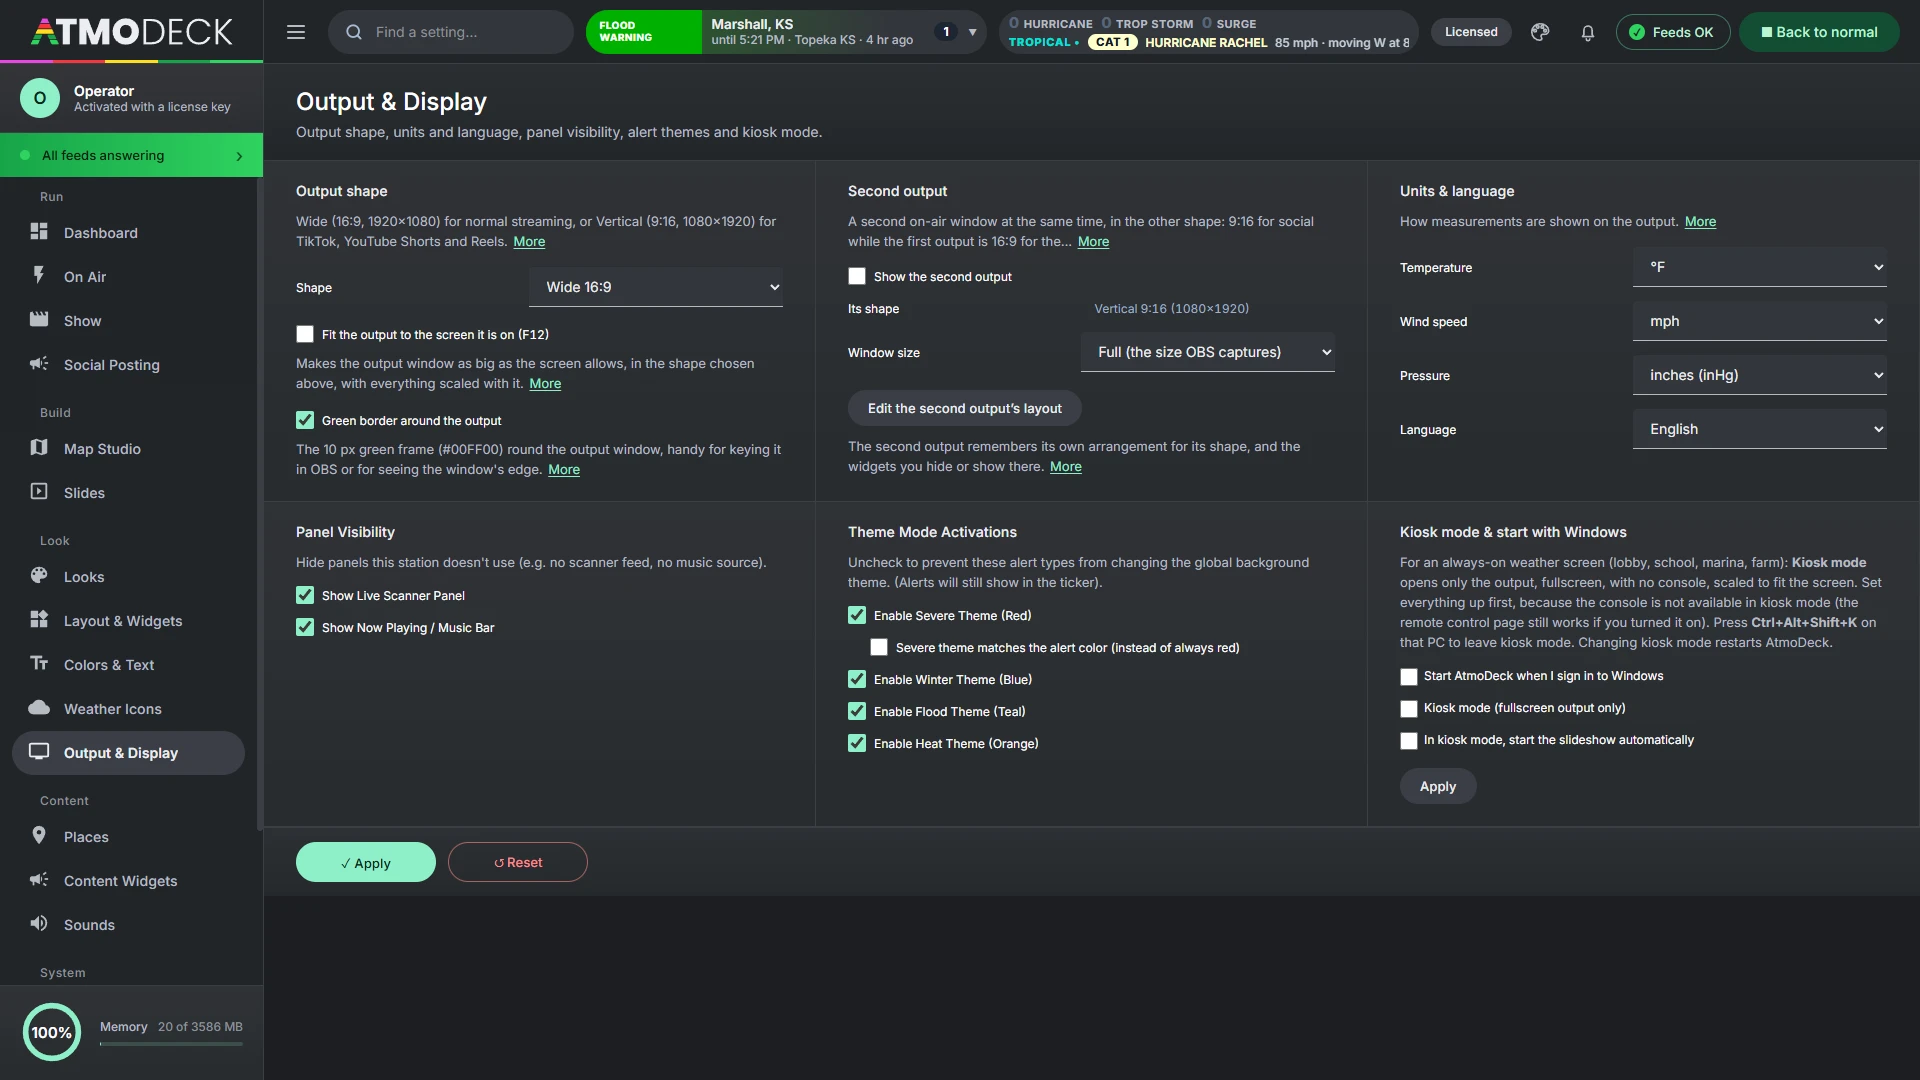
Output & Display: output shape, units and language, Panel Visibility (hide the scanner panel or the now-playing bar if you do not use them), Layout Style (see section 7.6), the severe theme and kiosk mode. Widget Layout and Widget Background are on the Layout & Widgets page (section 8.2, section 7.6).
7.4 Units and language
In Output & Display > Units & language choose temperature (°F or °C), wind speed (mph, km/h or knots) and pressure (inHg or hPa), and the language (English, Spanish or French: section 7.9). Units apply to the bottom bar, hourly and 5-day forecasts, Coming Up, the leaderboard, your weather station and chat cards. Alerts, ticker text and forecast slides stay in US units. Spanish translates the fixed labels and weather words on the output; forecast text from the National Weather Service (alerts, discussions, storm reports) is written in English and is not translated. Changing the language reloads the Output window.
7.5 Weather icons
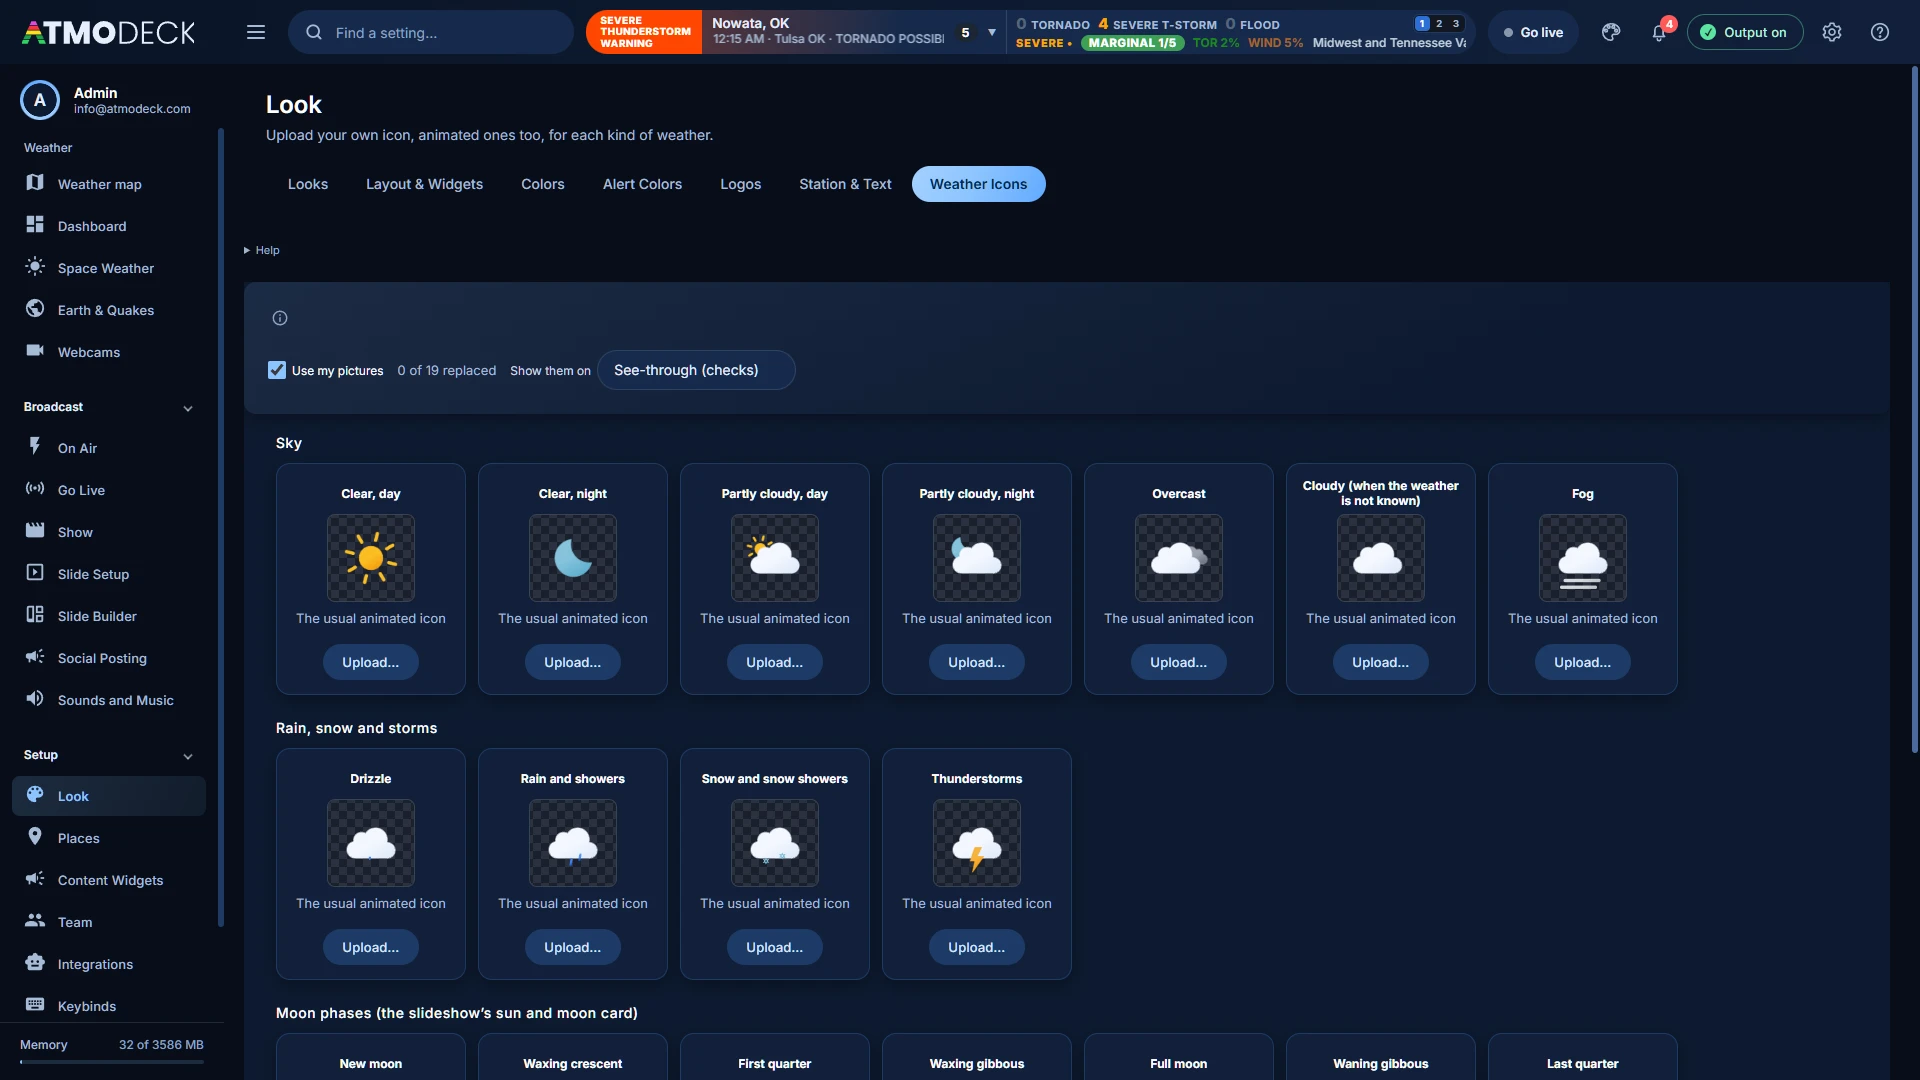
The Weather Icons page (Look group) lets you replace the icon for each kind of weather with a picture of your own. It has a card for every kind the app draws: clear, day and clear, night, partly cloudy, day and night, overcast, cloudy (used when the weather is not known), fog, drizzle, rain and showers, snow and snow showers, thunderstorms, and the eight moon phases.
Press Upload on a card (or drop a picture on it). PNG, GIF, WebP, AVIF, JPEG and SVG pictures work, up to 3 MB each, and animated GIF, animated PNG, animated WebP and animated SVG pictures move wherever they are shown. A square picture with a see-through background looks best.
Your icons are used everywhere an icon is drawn: the bottom bar and the hourly bar, the forecast slides you ask for with a right click on the map, the weather icons above the cities on the map, and the moon card.
A kind of weather with no picture of its own keeps the usual animated icon. Use the usual on a card goes back for that one, Use the usual icons for all goes back for every one, and Use my pictures switches them all off and on without deleting them. A background choice shows them on see-through checks, dark, light or blue.
The pictures are kept in the program's own local store, not in the settings, so a settings backup remembers which icons you replaced but not the pictures: upload them again on a new computer. They are not part of a look (section 7.7).
7.6 Widget background and layout style
Widget Background and Layout Style are both on the Layout & Widgets page:
Widget Background draws a solid backdrop behind every visible widget. Tick Enable Background Fill, choose the color and opacity, then click Apply background. Connect Buffer (0 to 200 pixels) controls how close two widgets must be for their backdrops to merge into one continuous shape; set it to 0 to keep every widget separate.
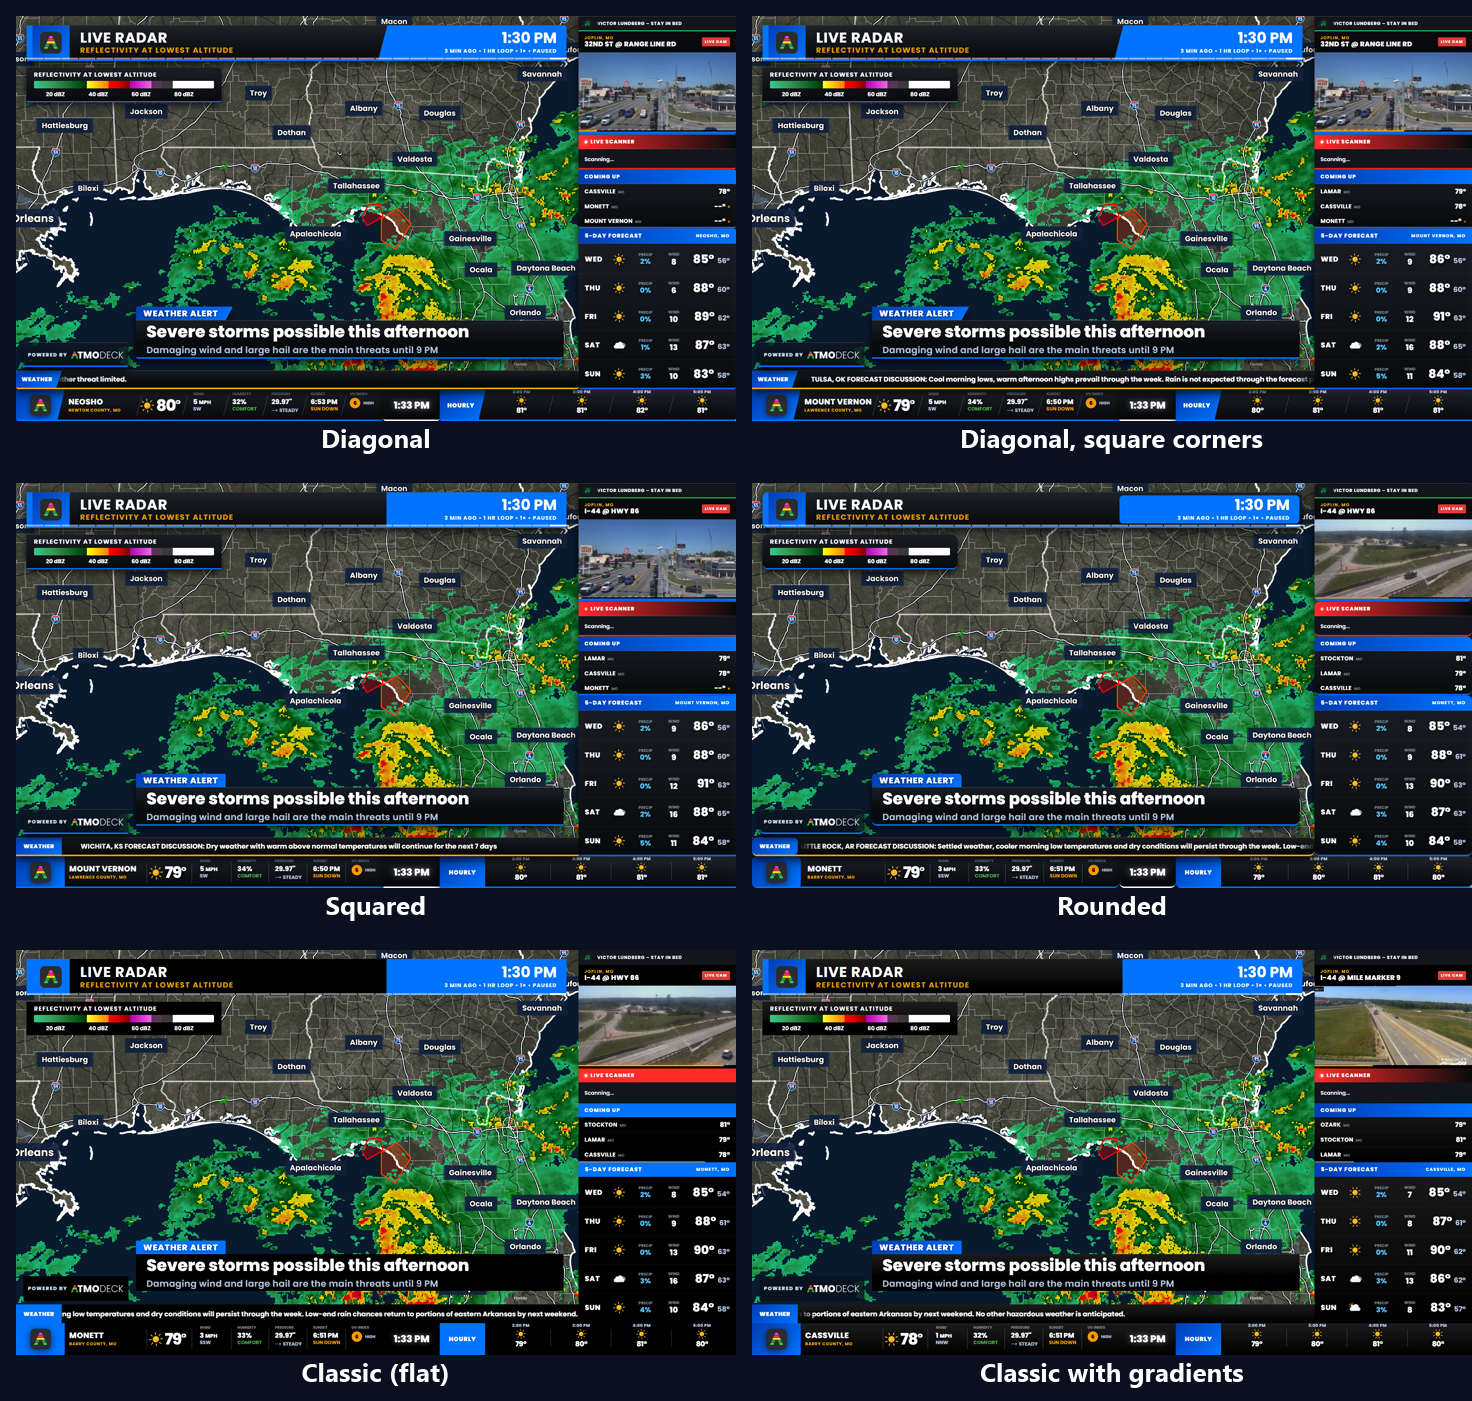
Layout Style sets the shape of the panels, labels and dividers, and it applies the moment you choose it:
Diagonal: the original look, with slanted label boxes and dividers and softly rounded panels.
Diagonal, square corners: the same slanted labels and dividers, with square panel corners.
Squared corners: no slants, square corners.
Rounded corners: no slants, well-rounded corners.
Classic (solid, flat): one flat color for every panel, label and title bar, with no gradients, no slants, no shadows and no colored line along the bottom of a widget. It is the style a new install starts with, and the colors it uses are the ones chosen in Look > Colors (flat black until you change them): the Main Panel Background, the News Ticker Background, the title bars, the logo box, the Live Scanner, Now Playing and LIVE CAM tag colors. The radar header, the storm list and the legend are flat in it too.
Classic with gradients: the same squared shape and plain bottoms, but the panels, labels and title bars keep their soft gradients.
An install that had already saved a style keeps it; only a new install starts in Classic. In every style but the two diagonal ones the HOURLY and ticker titles are centered in their boxes. The lower third (section 10.3) and the radar header dress themselves in whichever style is chosen.
The same Output in each of the six layout styles.
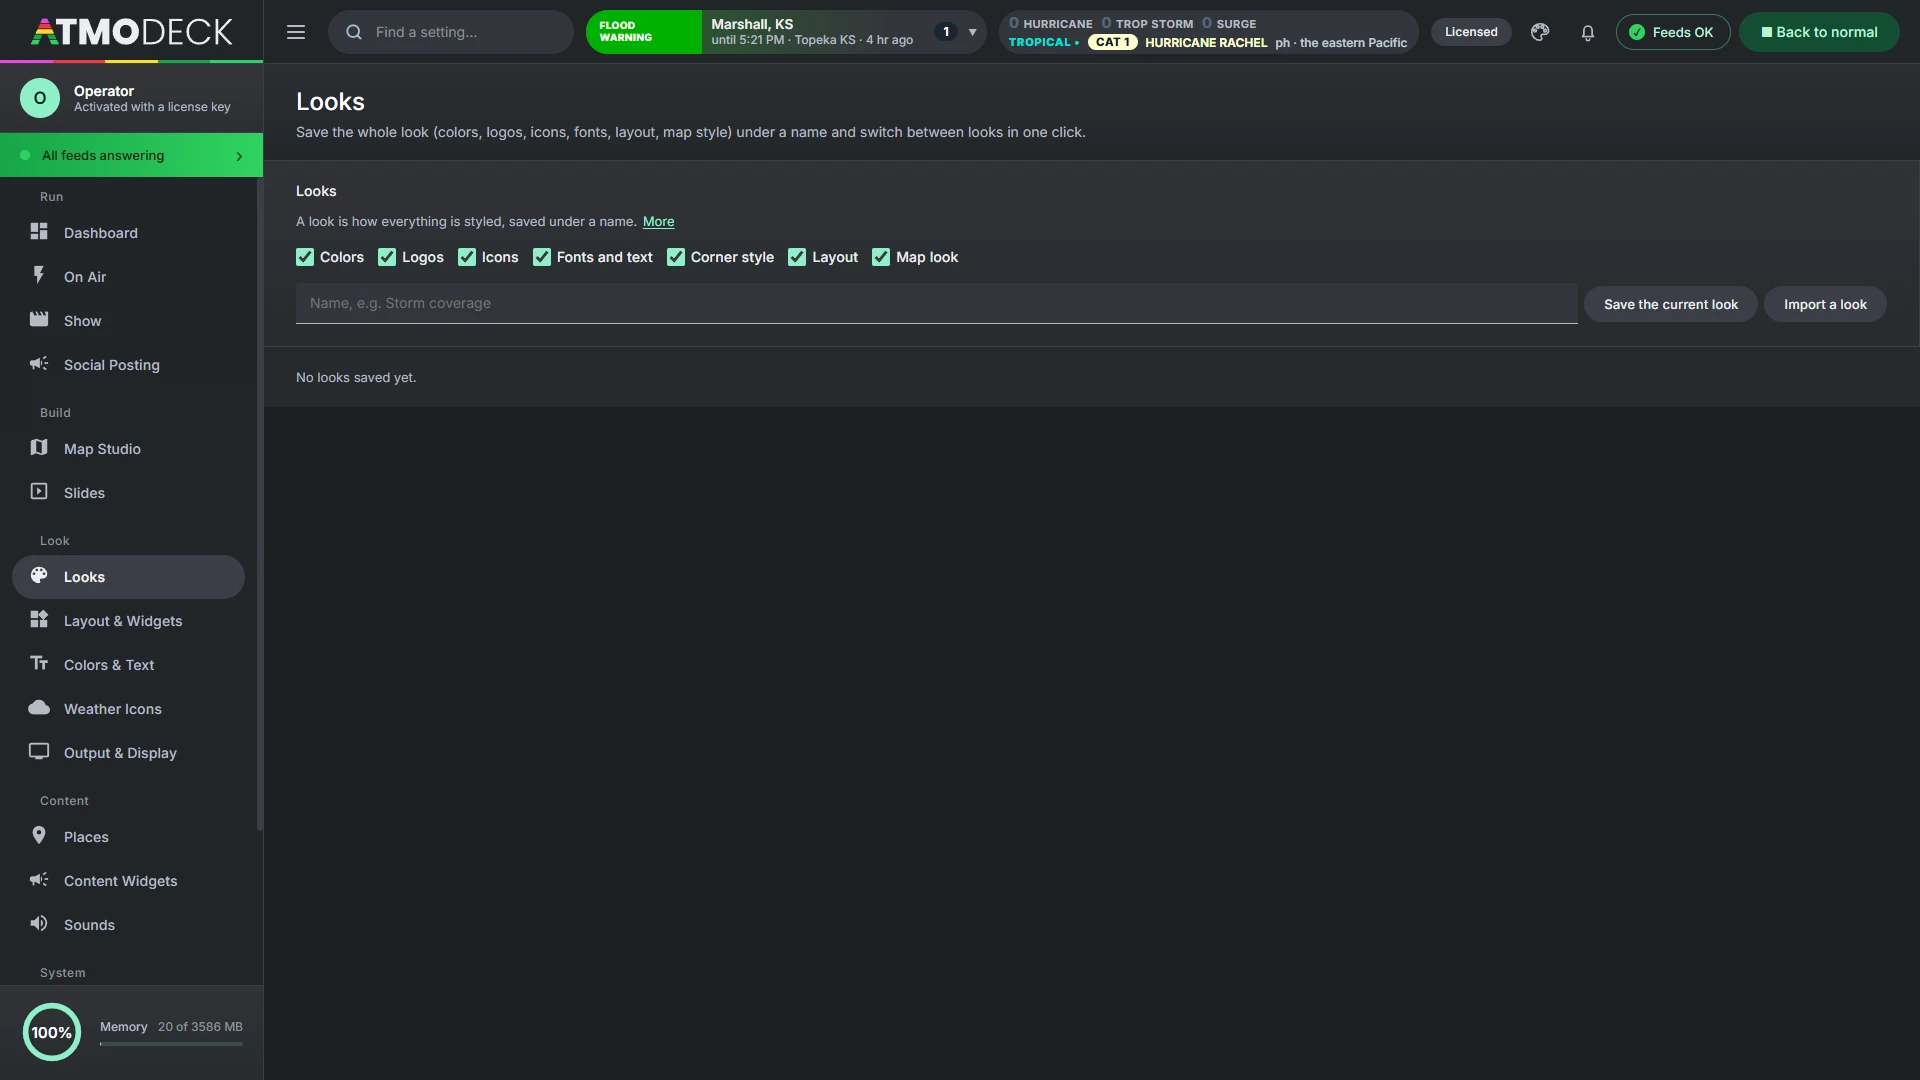
7.7 Looks
A look is how everything is styled, saved under a name. Under Saved looks & sharing in Look > Looks (and on On Air > Looks, one button for each) tick what the look should remember, name it and press Save the current look:
Colors (the palettes and alert colors), Logos, Icons (the weather icons on the map), Fonts and text (the font of the broadcast), Corner style (the layout style and the backdrop behind the panels), Layout (where the widgets are) and Map look (the base map, labels, header and legend, alert style and color tables).
Switching to a look puts those back at once, on the Console and the Output. Your places, cameras, content and keys are never part of a look, so a look can be switched on air without touching what the show says.
7.8 Color opacity, and the Glass look’s edges
Two things about colors (Look > Colors) apply to every look, and matter most in the Glass look:
Every color has its own opacity. Each color row, and each grouped role, has a slider from 0 to 100 beside the color. Left alone, a color is as it always was: solid, or in the Glass look as see-through as the frost. A color you pick for a frosted panel keeps the frost's see-through until you move its slider.
Glass panels have no edge line until you choose an edge color. Pick one and the line is drawn in it; clear it and the panels are edgeless again.
In the Glass look the conditions, hourly, clock and ticker panels take the frost's colors too, so every panel on screen matches.
7.9 English, Spanish and French
AtmoDeck's words on the Output can be in English, Spanish or French. Choose the language on the Output & Display tab of the Look page. The labels of the widgets and slides, the names of the alert types and the days follow it. The Voice and the Teleprompter can also be set to a language of their own.
8. The on-air layout
Every panel on the broadcast is a widget you can move, resize, switch off and configure. Layouts save the whole arrangement.
8.1 Widgets
Every widget, and what it shows. Turn them on in Layout & Widgets and place them in Edit Mode.
Widget
What it shows
Conditions Strip
Location, temperature and icon, plus stat blocks (wind, humidity, pressure and more).
Clock
The current time.
Hourly Forecast
The next hours, or the next days.
Camera / Now Playing
The live camera with location label, and the now-playing music line.
Live Scanner
The current scanner text. While a transmission is on the air the text bar fills red, and the title bar's gradient colors can be changed (section 7.1).
Coming Up
The next cities in the rotation with their temperatures.
5-Day Forecast
A multi-day (or multi-hour) forecast for the current city.
Ticker
The scrolling or flipping message bar.
Threat Matrix
The severe weather threat panel. It appears only during an alert.
Alert Map
The county mini map. It appears only during an alert.
Active Alerts
A count of active alerts plus a list of the newest. Off by default.
Storm Reports
Live local storm reports (tornado, hail, wind damage) for your counties, newest first. Off by default.
Severe Outlook (SPC)
Today's Storm Prediction Center risk level with tornado, hail and wind probability gauges. Off by default.
Regional Leaderboard
Hottest, coldest, windiest and highest rain chance among your cities. Off by default.
Radar
NEXRAD radar over your counties: a looping reflectivity view, velocity, or both in rotation, with tornado and severe thunderstorm warning polygons, city names and a legend. Choose a drawn county map, satellite, topographic or shaded-relief map, in a rectangle or a circle. In storm-chaser mode it follows your phone with a YOU marker. Off by default.
River & Lake Gauges
Water levels against flood stage. Off by default.
Earthquakes
Recent earthquakes near your area with magnitude, distance and time. Off by default.
Wildfires
Active wildfires near your area with size and containment. Off by default.
Drought Monitor
How many of your monitored counties are in each drought category. Off by default.
Marine & Tides
NOAA water levels, trend and next high or low tide. Off by default.
Watches
Active NWS watches (tornado, severe thunderstorm, flood and more) for your counties, with the counties covered and when each ends. Off by default.
Space Weather
NOAA's planetary K-index, the G, S and R storm scales and a note on whether aurora is likely at your latitude. Off by default.
Air Quality
US air quality index for your first few forecast towns, with a color for each level. Off by default.
Tropical (Hurricanes)
Active tropical systems from the National Hurricane Center, with category, winds, movement and distance from your area. Right-click it to filter by ocean basin and kind of system. Off by default.
Power Outages
Customers without power in your monitored counties, with a bar per county. Off by default.
My Weather Station
Your own station: temperature, feels-like, humidity, wind, pressure and rain today, from Weather Underground, WeatherFlow Tempest or Ecowitt. Set it up in Content Widgets. Off by default.
Chat Weather Request
A card that appears when a Twitch viewer types a command such as !weather Springfield, MO. Set it up in Automation. Off by default.
Countdown
Counts down to events you add (a stream, a sponsor spot, a holiday). Hides itself when nothing is counting down. Off by default.
Lightning Safety (30-minute rule)
Counts down from the last flash seen near a place and says ALL CLEAR when the wait is over. Shows itself only while lightning is near. Off by default.
World Clock
The time in up to six cities or time zones. Off by default.
Custom Data 1 to 3
Show anything from a web address that returns JSON or an RSS feed: your own sensor, a sports feed, a DOT feed. Set up in Content Widgets. Off by default.
Text Card
A message you type, such as a closing, a sponsor or "back after the break", with an optional schedule. Off by default.
Closings List
A manually entered list of schools, events or roads with a status. Off by default.
Sponsors
Logo images that rotate on a timer. Off by default.
QR & Social
A scannable code plus a handle. Off by default.
Popup Box (slides and soundings)
The box the forecast slides and the soundings you ask for with a right click on the map appear in (section 18.13). Place and size it in Edit Mode; it shows only while one is up.
Lower Third
Cycling titles with an optional label box above and subtitle under, dressed like the rest of the broadcast, with breaking news that covers it (section 10.3). Off by default.
Radar Header
The header of the radar map: title, product, time, LIVE badge and timeline, dressed like the broadcast or built from your own picture (section 23.12). Shows while the map is on.
Radar Legend
The color legend of the product on the map, with words or values (section 23.13). Shows while the map is on.
Storm Arrival Times
The cities each storm will reach, with the time (section 20.9). Shows while the map is on.
Radar Map (the map itself)
The whole radar map of Map Studio as a widget. It starts as the full picture and can be moved and resized in Edit Mode (section 8.11). Shows while the map is on.
Powered by AtmoDeck
A small "Powered by" badge with the AtmoDeck logo. It is always on, always in front of every other widget and layer (nothing can cover it, in Edit Mode too) and cannot be hidden on the Map Studio and Solo plans (the Standard and Pro plans can switch it off, section 8.3), but you can move it anywhere and resize it (down to half its normal size).
More detail: Overlays and live feeds
Overlays and live feeds
In Look > Layout & Widgets > Overlays and live feeds you can add widgets that have no header or frame, as many as you like (up to 24):
Picture. A PNG, JPG, WebP, GIF or SVG (up to 25 MB). A PNG with a clear background lays over the picture like a frame, a logo or a graphic.
Computer camera. A webcam or capture card on this computer, picked by name (Find cameras). Several at once, each its own camera. Mirror it if you want.
Stream link. HLS (.m3u8), MP4, YouTube and Vimeo links, snapshot or MJPEG addresses and web pages, with or without sound. A web page cannot play an RTSP address (rtsp://): have the camera or OBS send it out as HLS.
Guest camera. A person's phone or computer, sent over the network. Copy the link AtmoDeck makes (the phone remote must be on, with Secure https) and send it to the person. They open it, allow the camera, and tap Start; their picture appears in the box, and they can stop and start again. The link works for that one overlay and nothing else of the remote, so it can be shared with only that person, but anyone who has it can send a camera. Guests need to be on the same network as this computer, and the phone shows a "not private" warning once (the certificate is your own computer's).
Each overlay is a widget like the others: place and size it in Edit Mode on the output, switch it off, and choose how it fits its box (the whole picture, filling the box, or stretched), how strong it is and how round its corners are. A Layers list under the overlays puts them in order: over the panels (top), the panels and widgets, between the show and the panels, then the show and the radar map. ▲ ▼ moves one up or down, and across the panels line to the other side.
The Show (the slides and intros of a show) is a widget too, so the show and the radar map are two boxes you can move, size and switch off independently on the same output.
8.2 Edit Mode: moving and resizing
Open Layout & Widgets. Widget Layout is the first card at the top; click Enter Edit Mode. The Output window now shows a dashed outline on every widget.
Move: drag anywhere on a widget. It snaps to a 20-pixel grid and to the edges of other widgets and the stage.
Resize: drag the small handle at the bottom-right corner. This changes the box only. Make it taller and the rows or maps get more room; make it wider and the content gets more width. The text and elements inside keep their size, so nothing is stretched or shrunk. To make the content or the title bar bigger or smaller, use the Size sliders in the widget's right-click menu (section 8.4).
Nudge: click a widget to select it, then use the arrow keys for one pixel at a time, or hold Shift for ten.
Undo:Ctrl+Z undoes the last move, resize or nudge.
Overlap: widgets can overlap. The Threat Matrix, for example, can sit on top of another panel or in a spot of its own.
Pick the one behind: when widgets overlap, a click grabs the one in front. Click again in the same place, without moving, to select the one behind it (and the next, and round to the front again). The one you pick comes to the front so you can see it, and a drag then moves it. The prompt at the top of the Output says which one is selected.
Reset Layout in the same Widget Layout card returns every widget to its original position and size.
Editing is live. Edit Mode changes the actual output, and viewers can see the green edit outlines. Use it off air or when the audience will not notice. Click Exit Edit Mode when you are done.
The Threat Matrix and Alert Map are normally invisible. While Edit Mode is on, they are shown as placeholders so you can position them.
8.3 Turning widgets on and off
Below the Widget Layout and Widget Background cards, Layout & Widgets lists every widget with a checkbox. Unchecking one removes it from the output completely. Its saved position and size are remembered, so turning it back on puts it right where it was. The widget background (below) also drops out behind a hidden widget. The one exception is Powered by AtmoDeck: its box is always ticked and greyed out, so it cannot be turned off.
Standard and Pro plans. On the plans for 3 and 6 computers the box of Powered by AtmoDeck is not greyed out: untick it (or right-click the badge in Edit Mode and choose Hide this widget) and the badge is gone from the Output, from the radar map, and from the screenshots, clean screenshots, recordings and clips made of it. Tick it to bring it back where it was. The plan is read from your license, so nothing needs to be entered.
8.4 Right-click options
While Edit Mode is on, right-click a widget in the Output window to change what it shows. Options save automatically and update the Console. The menu only opens in Edit Mode so a stray click can never put a menu on air. Every menu (except the Powered by badge, which cannot be hidden) also has a Hide this widget button.
Size: content, title and title lock (every widget)
Each widget's menu has a Size section:
Content size (40% to 300%): how big everything inside the widget is. Drag the box handle for more room, and this slider for bigger content.
Title size (50% to 250%): how big the title bar is, for widgets that have one (most panels). It changes the title only, not the content.
Lock title height when resizing (on by default): the title bar keeps its size however tall the box is. With it off, the title bar grows and shrinks along with the height of the box.
Reset size to default puts the widget back at its designed size.
Vertical (9:16) and wide layouts keep their own sizes. The Ticker has its own text-size options, and the Powered by badge simply scales as one piece.
Conditions Strip
Tick the stat blocks you want: temperature, current conditions, wind, humidity, dew point, pressure, sun, moon, UV index and air quality. If both Sun and Moon are on, the one matching day or night is shown. When many blocks are on, the stat area shrinks to fit the strip, down to half size.
More detail: Hourly Forecast, 5-Day Forecast, Coming Up, Ticker and more
Hourly Forecast
Choose Hours (1 to 12) or Days (1 to 6). In Days mode the widget's title changes from HOURLY to DAILY and each item shows the high and the low.
5-Day Forecast
Choose Daily (1 to 6 days) or Hourly (1 to 8 hours). The panel title updates to match, for example "4-HOUR FORECAST". It stays on screen during an alert; the threat panel appears in its own box.
Coming Up
Choose how many cities to list, from 1 to 6 (the default is 3). The box keeps its size; with more cities the rows get smaller to fit.
Ticker
Weather covers forecast discussions, mesoscale discussions, weather history and storm reports.
Font, Headline size and Title size set how the ticker text and its title label look. Leave the font blank for the default, or type any font installed on your PC (Arial, Impact, Segoe UI and so on). The text keeps this size when you resize the ticker box, so you can make the box shorter or narrower without shrinking the text, and the title bar fills the full height of the box.
There is no built-in news source. To show headlines, add your own feed under Custom feeds.
Turn Weather off and remove your feeds to leave the ticker empty. Alerts and breaking messages still override the ticker whenever they occur.
Custom ticker feeds
Under Add a feed, enter:
a Title, shown in the label box at the left of the ticker (up to 30 characters);
a Source: either an RSS feed address (starting with http or https), or your own text, with separate messages divided by a vertical bar, for example Joplin wins 3-1 | Carthage falls in OT;
a Title color, used for the label box background (the label text switches between black and white automatically for readability);
a style: Scrolls moves each message across the bar, Flips shows each message in place and swaps it every few seconds.
You can add up to ten feeds, switch each on or off, or remove it. RSS feeds are refreshed every 10 minutes.
News is up to you. AtmoDeck ships without a news source. Add your local station or newspaper RSS feed as a custom feed. Each publisher sets its own terms, so make sure you may rebroadcast their headlines.
Active Alerts
Set how many alerts to list (1 to 12). The widget shows the total count and the newest alerts first, with the counties affected, how long ago each was issued and when it ends.
Information widgets
Storm Reports: choose how many reports to list (1 to 10). Reports are for your monitored counties only and are colored by type (tornado, hail, wind, flood, winter).
Severe Outlook (SPC): shows the day's risk category (general thunder up to High) and the highest tornado, hail and wind probabilities found across your cities. It refreshes hourly. A rehearsal risk from the On Air page's SPC simulator shows here too.
Regional Leaderboard: tick which lists to show (hottest, coldest, windiest, rain chance) and how many cities per list (1 to 6). It updates as the city rotation refreshes its data.
Radar
This is the Radar widget: a small NEXRAD or Environment Canada radar you can place in a box. The full-screen radar map, with live Level II, national products, satellite, 3D and hurricanes, is Map Studio (chapter 18).
Shows NEXRAD radar over your counties, zoomed to fit them. Right-click it in Edit Mode for:
Radar type:Reflectivity (rain and storms, a looping 5-minute animation), Velocity (which way the wind is moving relative to the radar: green toward it, red away from it, useful for spotting rotation), or Rotate between the two every 8 to 120 seconds. Velocity shows the latest scan from the nearest one to three radar sites; a single-site scan cannot be looped.
Warnings: tornado and severe thunderstorm warning polygons are drawn on the map (red and yellow) while they are active, with a small legend. This radar map is separate from the Alert Map that appears during alerts.
Map style:Counties (the drawn map, with the colors below), Satellite, Topographic (roads, towns and rivers) or Shaded relief (terrain). The satellite, topographic and relief maps come from the USGS National Map and need an internet connection.
Shape:Rectangle or Circle. A circle uses the largest circle that fits the widget's box, with a white ring, and the label and legend move inside it. Make the box square if you want the circle to fill it.
Map color (Counties style only): Midnight blue, Slate, Deep ocean, Forest, Dusk purple, Light, or Custom (pick your own land and outline colors).
City names, city dots and a color legend can each be switched off, plus the opacity and (for reflectivity) the number of frames and the frame speed. City names that would overlap are hidden automatically.
Tropical (Hurricanes)
Right-click it in Edit Mode to choose which ocean basins (Atlantic, Eastern Pacific, Central Pacific) and which kinds of system (hurricanes, tropical storms, tropical depressions, potential cyclones and others) to list, and how many to show. Anything switched off is left out of the list and the count.
Power Outages
Shows the number of customers without power in your monitored counties, with a bar for each county (yellow, orange, red as the number grows). Right-click it for how many counties to list, a minimum number of customers to hide tiny outages, and an optional statewide total. The data comes from the free ORNL ODIN outage feed and only includes utilities that report to ODIN, so a county that shows nothing may still have an outage. It refreshes every few minutes. Turn it on in Layout & Widgets.
Closings List
Right-click it for Display: Pages (a few rows at a time, changing every few seconds) or Scrolling ticker. A tall box scrolls the whole list upward without stopping; a wide, short box crawls it sideways like the news ticker. Set the scroll speed in pixels per second.
Alert Map
The Alert Map is the small county map that appears during an alert (it shows placeholders in Edit Mode). Right-click it in Edit Mode for the same look options as the Radar:
Map style:Counties (the drawn map), Satellite, Topographic or Shaded relief. The picture only shows inside your monitored counties, and alert colors are drawn over it. Satellite, topographic and relief maps come from the USGS National Map.
Shape:Rectangle or Circle. A circle shrinks the map so all of your counties fit inside it.
Map color (Counties style only): Default gray, Midnight blue, Slate, Deep ocean, Forest, Dusk purple, Light, or Custom.
River & Lake Gauges, Earthquakes, Wildfires, Drought, and Marine & Tides
River & Lake Gauges: pick gauges in Content Widgets. NWS river gauges include their flood stages automatically and show NORMAL, ACTION STAGE or MINOR, MODERATE or MAJOR FLOOD. USGS sites need a flood stage typed in. Use Find NWS gauges near my area to list nearby gauges and add them with one click.
Earthquakes, Wildfires and Drought Monitor are three separate widgets. Right-click Earthquakes for the radius in miles, the smallest magnitude and how many to list; right-click Wildfires for the radius and how many to list. Drought Monitor counts your monitored counties by drought category from the US Drought Monitor. To rotate them in one box like a single panel, put them in a slideshow group.
Marine & Tides: add NOAA water-level stations in Content Widgets (use Find stations near my area). It shows the current level, whether it is rising or falling and, where tide predictions exist, the next high or low. Coverage is the coasts and the Great Lakes, so inland lakes are not included.
The 5-day forecast's details. Right-click the 5-day forecast and look under Show. Switch off any of the Weather icon, Chance of precipitation, Wind, High and Low to leave it out of every row; in the hourly forecast the high is the temperature and there is no low. State after the city in the title can be switched off for a station whose cities are all in one state, so the title reads "Sioux City" rather than "Sioux City, IA".
Lightning Safety. The widget counts down from the last flash the GOES-East lightning mapper saw within the radius of its place, starts again with each new flash, and says ALL CLEAR for ten minutes when the wait is over. Right-click it in edit mode for:
Place: one of your forecast towns, or A spot of its own with a name, latitude and longitude (a ballpark, a fair).
Radius, miles (2-30) (10 by itself) and Wait after the last flash, minutes (10-60) (30 by itself).
Keep it shown when there is no lightning; otherwise it shows itself only while lightning is near.
Write the all-clear post: when the wait ends, the words are put in Social > Write a post for you to send. It is never sent by itself.
While the widget is on it asks for new flashes every 20 seconds.
8.5 Saved layouts and shortcuts
A layout is a named snapshot of the whole arrangement: every widget's position and size, which widgets are on, every widget's content options and your slideshow groups. Use layouts to jump between, for example, "Normal", "Severe" and "Sports".
Saving
Arrange the widgets the way you want them.
Open Layout & Widgets, type a name under Saved layouts, and click Save current layout. Saving with an existing name overwrites it.
Each saved layout has Apply now, Update from current and Delete buttons, and its name can be edited. You can keep up to 20 layouts.
Switching
By button: every layout appears as a button under Layouts on the On Air page. The active layout is highlighted.
By keyboard shortcut: click the shortcut box on a layout and press the keys you want, for example Ctrl+Alt+1. A shortcut needs at least one modifier (Ctrl, Alt, Shift) unless you use a function key such as F9. Press Esc in the box to clear it.
Shortcuts are global. They work even when OBS or another program has focus, which is what you want on air. If a combination is already used by another app, the layout shows a warning; pick a different one. Because they are global, avoid combinations you use in other software.
8.6 Slideshow groups
A slideshow group puts several widgets in one box and lets them take turns, for example Radar, then Storm Reports, then Sponsors, all in the same spot.
Open Layout & Widgets and click + New slideshow group.
Name it, set Seconds each (3 to 300), and tick the widgets that belong in it.
Position the box in Edit Mode. Every widget in a group shares the position and size of the first one you ticked, so moving or resizing any member moves the whole group.
Members fade in and out in turn. A widget that is switched off in the list above, or that has nothing to show (an empty text card, for instance), is skipped. You can make up to 8 groups, a widget can belong to only one, and the Threat Matrix and Alert Map cannot be grouped. Groups are saved with your layouts, so one layout can rotate while another does not.
8.7 Starter layouts, sharing and automatic switching
Starter layouts. In Layout & Widgets, Starter layouts lists ready-made arrangements: Severe Weather, Storm Chaser, Daily Forecast, Sponsor Friendly, Weather Station and Minimal. Click Add to save one to your layouts, then Apply now. It turns its widgets on in a sensible place; adjust anything in Edit Mode and use Update from current to keep your changes.
Sharing. Each saved layout has an Export button that writes a .atmolayout.json file, and Import a layout file adds one someone sent you. A layout file holds widget positions, which widgets are on, widget options and slideshow groups, and optionally your colors and layout style. It never includes your logos, sponsor images, closings text, API keys or license. On import you choose whether to also apply its colors and style.
Automatic switching. Under Automatic layout switching pick a saved layout for the severe theme and one for when alerts clear (by default it returns to whatever layout was on air before). It only reacts when the alert theme changes, so a layout you pick by hand during an alert is left alone.
8.8 Show Frame: the set of a presenter’s segment
Show Frame (Look > Layout & Widgets) is the set of a presenter's segment, drawn under the map in the colors of your Look: a slash of the accent color at the top left and bottom right with a slow sheen, faint diagonal lines that drift, your cities crawling along the bottom, and a frame round the map's window while it shows.
The Show Frame starter layout puts the map in a 16:9 window on the right with its header and legend inside it, your first computer camera in the column on the left, the badge at the bottom right, and the panels and ticker off.
8.9 Vertical (9:16) output
For TikTok, YouTube Shorts and Reels, open Output & Display > Output shape and choose Vertical 9:16. The Output window becomes 1080×1920 (plus the green guide border) and starts from a vertical default arrangement. Each shape keeps its own widget positions, so switching back to Wide loses nothing; adjust the vertical layout in Edit Mode like any other. Saved layouts store both shapes. Forecast slides only play in the Wide shape.
8.10 The second output
A second on-air window in the other shape, at the same time: 9:16 for social while the first output is 16:9 for the stream, or the other way round. Turn it on at Output & Display > Second output.
Show the second output opens a window called AtmoDeck Output 2. Point a second OBS (or vMix) source at it, as you did the first.
Its shape is always the other one from the shape chosen under Output shape. The wide and the vertical layouts are kept apart, so the second output has its own arrangement of widgets.
Edit the second output's layout opens Edit Mode in that window only (press it again to finish). What you move or hide there never touches the first output, and the other way round.
The map, the alerts, the settings and the lower third are shared. Forecast slides play in the wide window only. The sound comes from the first output; the second is silent.
Window size: full (the size OBS captures), fitted to this screen, or half. The window reopens with the app if it was on, and closing it by hand turns the switch off.
The second output is a second copy of the page, so it uses more of the computer, most of all when both show the radar map. Watch the Memory figure and the on-air lights on a small machine.
8.11 The radar map as a widget
In Edit Mode the radar map is a widget called Radar Map. It starts as the whole picture. Drag it to move it, and drag its corner to resize it: it keeps its 16:9 shape (9:16 in the vertical shape). The map inside is a scaled copy, so what it shows is the same at any size, and the header, legend and storm list stay on the stage where you put them. The popup box is worked out against the stage, so a slide or sounding stays where you placed it.
8.12 Kiosk mode and start with Windows
For an always-on weather screen (a lobby, school, church, marina or farm), open Output & Display > Kiosk mode & start with Windows. Start AtmoDeck when I sign in to Windows launches the app automatically. Kiosk mode opens only the Output window, fullscreen and opaque, scaled to fit the screen, with the cursor hidden and no console. Because the console is not available in kiosk mode, set everything up first (the remote control page still works if you turned it on). Press Ctrl+Alt+Shift+K on that PC to leave kiosk mode. Changing kiosk mode restarts AtmoDeck.
9. Content widgets and your own files
Some widgets show what you type or feed in: text cards, closings, sponsors, QR codes, your own data, and the text files that carry the scanner and the music.
9.1 Text, closings, sponsors, QR and your own data
The Content Widgets page is where you type what these widgets show. Changes save automatically and reach the output immediately, so there is no Apply button. Each section has a Show on air box that turns the widget on. A content widget that has nothing to show hides itself (it stays visible in Edit Mode so you can position it).
Text cards: a label (optional) and a message up to 300 characters, in Normal, Alert (red) or Sponsor (blue) style. Each card has an On switch and a schedule: Show all the time, Between two dates (a start and an end date and time), or a Daily window (a time range on the days you choose, including overnight ranges). Several active cards rotate; set the seconds per message by right-clicking the widget.
Closings list: a title, and rows of name plus status (CLOSED, DELAYED 2 HRS, EARLY DISMISSAL, or your own text). Switch a row off to remove it from the screen without deleting it. Long lists page automatically, or scroll like a ticker (right-click the widget).
Sponsor rotator: add logo images (they are shrunk automatically and stored inside your settings). Set the seconds per logo and whether logos fit whole or fill the box by right-clicking the widget.
Countdowns: add an event with a name and a date and time; with several, they take turns (right-click the widget for the seconds each).
World clock: pick cities from the list or type any time zone name such as America/Phoenix.
Sponsor report: at the bottom of the Content tab, a report of how long each sponsor logo and text card was actually on the output, by day. Choose a range (7 days, 30 days, this month or everything), then Export CSV or Export PDF to give to a sponsor as proof of airtime. It counts broadcast time while AtmoDeck is running and the widget is on and showing (not while it is empty, hidden, waiting its turn in a slideshow group or in Edit Mode). It measures airtime, not viewers, and the log stays on your PC.
Custom data: paste an address that returns JSON or RSS, click Look at it to see what comes back, then fill in the paths. For JSON, the list path points at an array (blank if the address returns a single object), the label path and value path pick fields from each item (like name and price, or sensor.reading.temp for a single value), and Before and After add symbols such as $ or °F. RSS feeds show the headlines. Each source refreshes on its own timer (1 to 60 minutes). You are responsible for the terms of whatever service you connect.
QR & social: a web address for the code, a heading such as SCAN TO VISIT, and a handle shown underneath. The code is generated inside AtmoDeck, so it works offline.
Tip. Save a layout with your sponsor and closings widgets on, and another without, then switch between them with a button or shortcut (see section 8.5).
9.2 Now Playing and Scanner text
The now-playing bar and the scanner line each display the contents of a plain text file that any other program can keep updated:
Track.txt holds the current song, shown in the now-playing bar (checked every 2 seconds).
Stream.txt holds the current scanner text (checked every second). The words "Scanning" or "Monitoring stream data..." show the idle state; anything else lights the scanner as active.
Use any file you like. In Content Widgets > Scanner and now-playing files, type or Browse to the full path of your scanner file and your track file (for example the text file your scanner software or music player already writes). The card shows whether the file was found and what it currently says. If a path is set and the file cannot be read, the output shows OFFLINE instead of an old value, and Use default goes back to the two files below. Only the first part of each file is read, and both files must be on this PC.
By default, put both files in AtmoDeck's data folder, %APPDATA%\atmodeck (paste that into the File Explorer address bar to open it). This folder is kept when AtmoDeck is updated. AtmoDeck also looks next to the program itself if a file is not found there. Use any music player plugin or scanner tool that can write the current title to a text file. If a file is missing or unreadable three times in a row, the bar shows OFFLINE. Hide either panel in Look > Output & Display if you do not need it.
Part 3Run a broadcast
The controls you use on air, severe weather, posting, shows, slides and automation.
10. Running a broadcast (On Air)
The On Air page is where you operate the show. Several controls exist for rehearsal, so it is important to know which ones affect what viewers see.
10.1 Everyday controls
The page is a column of cards. From the top:
Card
What it does
Layouts
A button for each saved layout, to switch the whole on-air arrangement. Save more in Layout & Widgets (section 8.5).
Looks
A button for each saved look: the whole styling (colors, logos, icons, fonts, layout and map style) switched in one click (section 7.7).
Alert color presets
Switches the alert colors and which alert types are hidden, all at once. Save presets in Look > Alert Colors (section 11.2).
Alerts & rehearsal
Toggle Severe shows how the severe theme looks on air without waiting for weather. Test Impact Ticker shows a sample impact message. Hide Alerts is ticker-only mode: alerts are still fetched but not shown, and it switches itself off if a new warning arrives. Hide Map keeps the alert mini map off the screen during alerts.
Ticker and Lower Third
Push your own breaking headline, one per line, to the Ticker, the Lower third or Ticker and lower third, with Push to Screen. On the ticker it replaces the bar with a BREAKING label; on the lower third it covers it (section 10.3). It stays until you press Clear, and you can push several lines and they cycle. The lower third shows pushed lines even when it is switched off in Layout & Widgets.
Overrides
Force Day Mode and Force Night Mode lock the color theme instead of following sunrise and sunset (click again to release). Force Next City skips to the next city in the rotation at once. Weather Override forces a weather condition (clear, cloudy, rain, snow, thunderstorm, fog) on the icons and descriptions, or returns to Live Data.
Data health
Which weather service is answering, and a warning when AtmoDeck has switched to its backup (section 26.1).
Threat simulator
Fake alerts, outlooks and storm reports for rehearsal (section 10.2).
Back to normal in the top bar (also called Reset Everything) clears forced themes, rehearsal alerts and overrides in one press and returns to normal automatic operation.
10.2 Rehearsal and simulators
The Threat simulator card puts test alerts on the real output, so use it off air, or on air only on purpose. A safety timer ends simulated alerts by itself after 20 minutes. (The Toggle Severe button of the Alerts & rehearsal card, section 10.1, switches the whole graphics package into the severe theme the same way.)
Tornado tiering: Base Warning, Observed Tornado, PDS Warning and Tornado Emergency, to see how each of the four tornado tiers looks and sounds.
Other tiers: Severe T-Storm Warn, Svr T-Storm (Tornado Poss), Flood Warning and Winter Storm Watch.
Test Multi-Alert Cycle and Test Overlapping Polygons check how several alerts at once behave. Clear Simulator Alerts removes them.
Demo mode shows the real radar with sample warnings and no banner, for practice or for a demonstration. Press it again to leave it.
SPC outlook: Slight, Enhanced, Moderate or High Risk shows that risk badge. Clear SPC Risk removes it.
Storm reports: Inject Test Reports puts test local storm reports in the ticker; Clear Storm Reports removes them.
Always clear before going live. Press Back to normal after any rehearsal so no test alert is left on the output.
10.3 The lower third
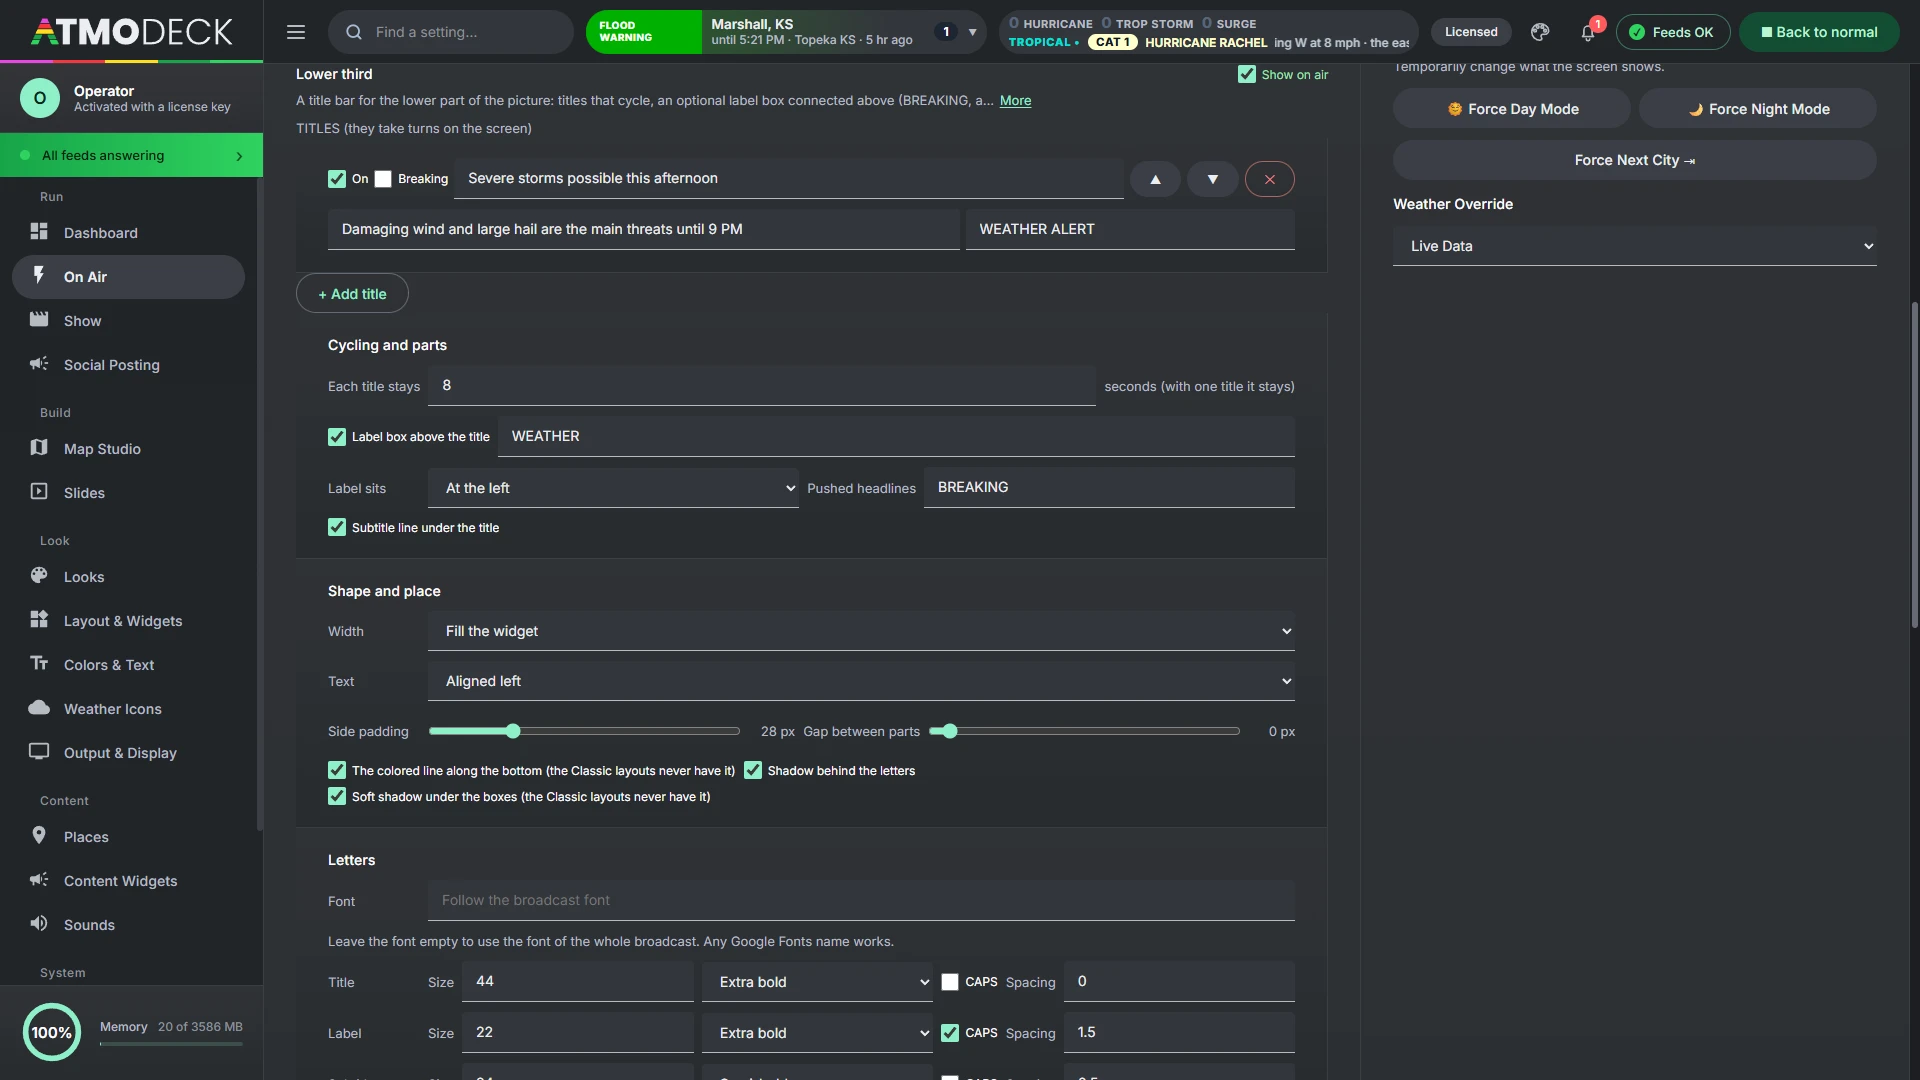
The Lower Third is a title bar for the lower part of the picture: titles that cycle, an optional label box connected above it (WEATHER, BREAKING, the name of a segment) and an optional smaller line under it for a subtitle. Turn it on in Layout & Widgets (it starts off), place and size it in Edit Mode like any widget, and write what it says on the On Air page, in the Lower Third card.
Titles. Up to 20. Each has its text, an optional subtitle, an optional label of its own (a blank one uses the label below), an On switch, a Breaking tick (see below) and arrows to reorder it. They take turns, each staying for the number of seconds you set (2 to 120); a single title stays put.
Label and subtitle. The label box can be switched off, takes any text (WEATHER by default) and sits at the left, middle or right of the title box. The subtitle line can be switched off too. When either is switched on, it keeps its room even for a title that has nothing in it, so the title never moves up or down from one title to the next, and turning the subtitle on does not move anything that was already there.
Shape and place. Fill the widget's width, or fit the words (and sit at the left, middle or right of the widget); text aligned left, centered or right; side padding and the gap between the parts; the colored line along the bottom and the shadows can each be switched off.
Letters. The font of the whole broadcast, or any Google Font; for the title, the label and the subtitle each its size, weight, CAPS and letter spacing.
Colors. It is dressed like the on-air panels: the corner style and slants of the chosen layout style (section 7.6) and the theme colors of the day. Each part (title box and letters, label box and letters, subtitle box and letters, the bottom line and the shadow) follows the style until you pick a color for it, and a slider sets how solid each box is, down to 0%, fully transparent. In the Classic styles it has no shadows or bottom line, as the other panels do not.
Animation. It comes and goes the way Layout change animation is set (Layout & Widgets): fade, cascade, wipe, swipe, rise, zoom, or none. When the title changes only the words change over; the boxes stay where they are. A part is animated as a whole only when it is added or removed (a title with a subtitle after one without, or a label that is not on every title).
Breaking news. Type a headline in On Air > Breaking, choose Ticker, Lower third or Ticker and lower third, and press Push to Screen. On the lower third it comes as its own layer over the whole lower third, the label, the title and the subtitle's room too, with its own colors (the Breaking look in the Lower Third card beside it: a red label box and bottom line by default, and a color for any other part). The lower third under it goes on cycling, and shows again when you press Clear. A pushed line appears even when the lower third is switched off. A title with its Breaking tick takes the same colors when it comes up in the cycle.
11. Severe weather alerts on air
When an alert touches your area, AtmoDeck changes the whole broadcast by itself. This chapter says what it does and how to tune it.
11.1 How alerts change the broadcast
When a qualifying alert affects your counties, AtmoDeck automatically:
switches the color theme to Severe (red, or the color of the alert), for tornado and severe thunderstorm warnings;
shows the threat panel in its own box and shows the alert map. The 5-Day Forecast and Coming Up widgets stay on screen; drag the Threat Matrix wherever you want it in Edit Mode;
shows the alert in the ticker area with its type, expiry, affected counties and description;
plays the severe alarm if you uploaded one (it repeats every two minutes while the severe theme is on air);
uses the Severe logo if you set one.
Tornado warnings are shown in tiers (base, radar-observed, PDS and emergency) with escalating colors, and multi-alert situations rotate through each alert in turn.
11.2 Configuring alert behavior
Hiding alert types. In Look > Alert Colors, Hide alert types lists the common NWS alert names; tick any you never want on your broadcast, or type other names in the box (separated by commas). A hidden type disappears everywhere: the ticker, alert strip, map, threat panel, sounds and color themes. Hiding a warning means viewers will not see it from AtmoDeck.
Output & Display > Severe theme: untick Enable Severe Theme (Red) to keep the day and night look during warnings. The alerts still show in the ticker. Under it is Severe theme matches the alert color: when ticked, the severe theme takes the color of the alert on screen (orange for a Severe Thunderstorm Warning, magenta for a Tornado Warning, and so on) instead of always being red.
Threat panel border: the bottom border of the Threat Matrix always matches the color of the threat it is showing.
Sounds: upload an alarm or chime for severe weather (Sounds and Music). Sounds are stored on this machine only.
Look > Alert Colors: set the background color for each NWS alert type. Anything unset uses the built-in color.
Look > Logos: give the severe theme its own logo.
11.3 Alert sounds and notifications, chosen by type
The Console's alert box has a Sounds & notify button that sets, for each kind of alert, whether it makes a sound and whether it tells you.
Four quick choices: Everything, Tornado · Severe · Flood, Warnings only and Notify with no sound. The one that matches the switches is lit.
A Sound and a Notify switch for each type: tornado, severe thunderstorm and flood & flash flood warnings and watches, other warnings, other watches, special weather statements, advisories and statements, and storm reports. A switch that puts new alerts in the bell is beside them; the longer words are folded below.
Sound governs the box's chime (the most severe new alert whose sound is on), the storm-report tone and the Output's severe alarm (it sounds when one of the alerts that turned the severe look on has its sound on; put on by hand it sounds as before).
Notify governs the new-alert items in the bell, the alerts of watched places and the alert types you follow on the Dashboard.
11.4 Sounds and Music, and where the sound goes
The Sounds and Music page (Broadcast group) holds the sound device of the Output, the volume with live level readings, the Listen button, the background music with its playlists and time periods, the equalizer, the startup sound and the alarm or chime for severe weather (section 11.2). Sounds are stored on this computer only.
Where the Output’s sound goes. Send the Output’s sound to any sound device, such as a virtual audio cable that OBS picks up as its own source, or to Nowhere.
11.5 Background music, playlists, the equalizer and ducking
The Sounds and Music page (Broadcast group) plays background music on the Output, under the shows, from playlists that play in the time periods you set, shaped by an equalizer, and it takes care that the music never talks over a video, a voice or an alarm. Music is yours to supply: add tracks you are allowed to broadcast. Everything the music does goes through one chain (equalizer, ducking, volume, meters), and it all comes out of the sound device chosen at the top of the page.
Where the sound comes out, and listening to it
Send the Output’s sound to picks the device: the Windows default, a real device, a virtual audio cable that OBS captures on its own, or Nowhere (silent). The music, the alarms, the voice and the show videos all follow it.
Listen to the Output (in the same card) lets you hear what the Output is playing, on this computer’s own speakers or headphones, whatever device the Output itself sends it to: handy when it goes to a virtual cable. It carries the music, and the videos, voices and alarms of the Output that can be captured (a voice made with Windows’ own built-in voices cannot be). Listening level sets how loud it is here, only here, and Heard here is a meter of it. Press Stop listening to end it; it also ends by itself when the Console closes. There is a small delay of a fraction of a second.
Volume and live output
The Music volume slider sets how loud the music is. Under it, two meters (left and right) show what the Output is sending right now, in decibels below full scale, with a white mark for the highest level of the last moments; the bar turns amber and then red as it nears 0 dB. A third bar, Ducking, shows how far the music is let through (100% is untouched). A line of text says what is playing, the track and its time, the playlist and whether a time period chose it, why the music is ducked, and which device it goes to. The buttons go to the previous or next track and play or pause the music.
More detail: Background music, Tracks and playlists, Time periods, Equalizer and more
Background music
Play background music on air is the switch. When it plays: all the time, or only while a show plays. Shuffle mixes the order of a playlist and Fade in when it starts sets how long the music takes to come up.
Now Playing widget chooses where the Now Playing widget gets its words. The default shows the artist and title of the track playing here (AtmoDeck reads them from the file’s tags when you add it, or from its name, like “Artist - Title.mp3”), and the text file you set up under Feeds again when nothing is playing. Each track has Title and Artist boxes to correct it. Choose the text file option to keep the old way.
The tracks, playlists and time periods are kept in the settings, and the tracks themselves on this computer; all of them travel to the other computers of a team with the rest of the setup.
Tracks and playlists
Tracks is your library: Add tracks takes audio files (mp3, wav, m4a, ogg). A track that is unticked is left out of every playlist, and Remove takes it out of the library and from every playlist. Each track has an Add to playlist list (a playlist that already has it is marked and cannot be picked again).
Playlists: type a name and press Make a playlist. Choose one in the list to see its tracks in the order they play, move them with the arrows, take one out, rename the playlist in the box beside the list, or Delete the playlist (the tracks stay in the library, and any time period that used it is removed).
Time periods
Each period names a playlist (or All tracks), the days of the week it applies to (S M T W T F S), and a from and to time. A period can cross midnight (from 22:00 to 02:00 belongs to the day it began on), and a from and to that are the same mean the whole day. The first period from the top that holds the moment wins, so put the more particular ones first and move them with the arrows; the tick at the start of a row turns a period off without losing it. Outside the periods chooses what plays when no period holds the moment: all the tracks, one playlist, or nothing. When the playlist changes, the old one fades out and the new one starts from its first track.
Equalizer
Ten bands, from 31 Hz (deep bass, on the left) to 16 kHz (treble, on the right), each from -12 to +12 dB, and a Preamp. Pick a Preset (More bass, More treble, Voices stand out, Broadcast with leaner lows and a clear middle, Loudness, Rock, Acoustic, Soft and dark) or move the sliders yourself; Reset to flat puts everything back. The bars behind the sliders are the live spectrum of what the Output is playing, so you can see the band you are changing. The equalizer shapes the music only, not the voice, the alarms or the videos.
Ducking
While a video with sound plays (a video step on the Show page, such as your recorded daily forecast), or a voice reading, an alarm or the intro sound, the music fades down; when it is over the music fades back in. Lower the music to is how far (0% is silent), Fade down over and Fade back in over are the times, and Wait after it ends keeps it from coming back between two clips that follow each other. Video files on camera slides are silent unless Let video files on camera slides play their own sound is ticked.
Ducking tracks: add sounds of your own to the page and play them from there or from a step of a show; while one plays, the music goes down and comes back after it. Only on the stream plays the music on the Output and the stream but not through this computer’s speakers. A program that captures the desktop’s sound, such as OBS with Desktop Audio, will not hear the music with this on.
11.6 Discord and webhook alerts
Turn on Post alerts to this webhook to have AtmoDeck post to a Discord channel, or to any web address that accepts a JSON POST (Slack incoming webhooks, Zapier, Home Assistant and similar), whenever an alert appears for your monitored counties. In Discord, open the channel's settings, choose Integrations > Webhooks > New Webhook, and copy the Webhook URL into the box.
Which alerts: tornado warnings and severe thunderstorm warnings are on by default. You can add flash flood warnings, tornado and severe thunderstorm watches, and every other warning.
What is posted: the alert type in the alert's color, the counties, when it expires (shown in each reader's own time in Discord), hail, wind and tornado threat, and storm motion when the warning has one. Other services get a JSON message with a text line and the same details as fields.
Once per alert. Each alert is posted one time. AtmoDeck remembers what it has sent, so restarting it does not repeat posts. Rehearsal alerts are never posted.
Mention (optional): text such as @everyone or a role like <@&123456> added to the post. Leave it empty and nothing is pinged.
Send a test post sends a clearly marked sample so you can check the channel.
Keep the webhook address secret. Anyone who has it can post to that channel. It is stored in your settings, so it is also in backups and exported settings. Only https addresses are accepted, and local network addresses are refused. AtmoDeck sends at most 30 posts a minute.
For a Stream Deck, use an HTTP request button to /api/do?a=ACTION&t=TOKEN on that address. Actions: layout (add &id=LAYOUTID), next-layout, prev-layout, hide-alerts, hide-map, theme-day, theme-night, reset. Only those actions exist; nothing else in AtmoDeck can be reached this way, and repeated wrong tokens are locked out for a minute.
12. Posting to social media
The Social Posting page: automatic alerts, posts written by hand, graphics and verification. Alert posting writes a post for each new watch and warning, with a picture of the area, and sends it where you choose. It is off until you switch it on, and every post waits for your click unless you say otherwise.
12.1 How alert posting works
The Automatic alerts tab of the Social Posting page (Broadcast group) posts each new watch and warning, with a picture of the area, to the places you choose: X, Bluesky, Mastodon, a Facebook page, Telegram, Discord, Slack, Microsoft Teams or any web address that takes a JSON message. It is off until you switch it on, and it never posts what was already in effect when AtmoDeck opened.
Every post waits for you by default. Posts go into a queue under Waiting for your click, where you can change the words, look at the picture, and approve or throw away. Turn off Ask me before each post to post by itself.
12.2 Destinations, and connecting X
X (connect your account) is included with your plan. Choose it in Add a destination, press Connect X, and approve AtmoDeck on X’s own page. You never type a password or a key into AtmoDeck. The page then shows your @name and how many posts you have used this month. There is a monthly limit of posts to X (300 by default), and a message tells you when it is used up. Disconnect removes the connection.
Bluesky: your handle and an app password (made in Bluesky under Settings, Privacy and security, App passwords; never your own password). Mastodon: your server and an access token. Telegram: a bot token and the chat or channel id. Discord, Slack and Teams: the webhook address of the channel. Facebook page: the page id and a page access token you create at developers.facebook.com. Each form says where to find what it asks for.
The passwords, tokens and webhook addresses are kept encrypted with this computer’s own key, in the main program only. The page shows only a masked version (for example “ends 1a2b”).
Send a test next to a destination posts a real test post to it. A test to X counts toward the monthly limit.
12.3 What gets posted
Which alerts: tornado, severe thunderstorm and flash flood warnings, tornado and severe thunderstorm watches, and every other warning or watch if you choose. For: alerts that touch your counties, anywhere in your states, or the whole country.
The words are written from what the Weather Service says: what, where (your counties first), until when in your time zone, the tornado, hail, wind and damage details, and what to do, in a plain, urgent or friendly tone. They are cut to fit each service (X 280 characters, Bluesky 300, Mastodon 500 and so on). Add your own hashtags and a link (links are never put in posts to X, which charges far more for a post with one).
Limits: at most so many posts an hour, and never an alert older than so many minutes. An alert is never posted twice.
12.4 The picture: your logo, the radar and Quick Take
Each post carries a picture of the area: the county map with your counties picked out and the alert’s own shape (or the counties it names) in the alert’s color, the alert’s name across the top, where, until when, the threats and what to do, and your station’s name. What a post looks like shows it as you set it.
Logo: the logo of the theme on air, one you choose just for posts, or none. Behind the logo: a light box, or nothing, so a logo with a transparent background stays transparent.
Show the radar in the picture puts the newest NEXRAD radar under the alert, with a label in the corner of the map.
A Quick Take is a five-second video of the alert over the radar of the last fifty minutes (eleven pictures, five minutes apart, ending now). Make one by hand under Write a post, or switch on Post tornado warnings as a radar-loop video to have each tornado warning go out as a video where the service can take one, and as the picture elsewhere.
Alerts that are for zones. A heat warning, a gale warning, a winter weather advisory and many more are issued for forecast zones and marine zones, not counties. The picture asks the Weather Service for the shape of each zone the alert lists and draws them all, so these alerts have a map too (an alert for open water shows the water and the shoreline).
A picture made by hand. Under Write a post choose An alert and pick any alert in effect. Radar over the map paints the national radar under the alert in the color table you choose (the built-in ones and the ones you installed in Map Studio), hiding echoes weaker than the dBZ you set. People, hospitals and schools in the alert adds how many people live inside it (2020 Census, about), and the hospitals and schools (OpenStreetMap, at least that many); an alert over water says nobody lives there, and one too big to count in a reasonable time says so.
12.5 Updates are comments, not new posts
When the Weather Service updates an alert, AtmoDeck does not post it again. It adds a short comment under the first post (a reply on X, Bluesky, Mastodon and Telegram, a comment on Facebook), and only when something a reader would want to know changed: the alert now ends at a different time (by five minutes or more), the tornado threat rose, hail grew by a quarter inch, the wind rose 10 mph, the damage threat rose, or counties were added or taken away. The same facts sent again make no comment. There are at most three comments for one alert (you can change it), they are text only, and a destination that has no first post to comment on (a Discord webhook cannot reply) gets nothing. Post when an alert is canceled early adds one more comment when an alert goes before its time.
12.6 Writing a post by hand
Write a post, at the top of the page, posts something of your own at once, to the destinations you tick, after one question. Type your words (a counter shows how each destination’s limit is getting on) and add, if you like, one of: An alert (its words are filled in for you and its picture is made), A Quick Take, A slide (AtmoDeck draws the slide and posts its picture; stop the show first if one is playing) or A picture or video from your computer (PNG, JPEG, GIF or WebP; MP4 or MOV up to 200 MB). Videos go to X, Discord, Telegram, Mastodon, Facebook and a Slack bot; the other destinations say that they cannot take one and are left unticked. A picture too big for Bluesky is made smaller for Bluesky alone.
12.7 Tropical storms
With Post storms the Hurricane Center is following on, AtmoDeck watches the National Hurricane Center’s list. When a storm appears while AtmoDeck is open it gets one post with the Center’s own cone picture, its name and strength (the category of a hurricane), winds, movement and pressure; each later advisory is a short comment under it, only when something real changed (a new class or category, 10 knots of wind, 8 millibars, or twelve hours of silence), or on every advisory if you choose that. Choose which oceans to watch (the Atlantic by default), Pause any storm, or press Post now on a storm that was already there when AtmoDeck opened. Warnings and watches for the coast arrive through the alerts above.
12.8 Extra-urgent alerts
A tornado emergency, a PDS (particularly dangerous situation) tornado warning and a flash flood emergency are the worst alerts, and they are the ones the Weather Service itself marks that way (nothing is guessed from radar). Under Extra urgent you choose which of them get their own treatment: the name in capitals (“TORNADO EMERGENCY for Jasper and Newton counties until 6:45 PM CDT”), the Weather Service’s own meaning of it and the order to take shelter, a frame in the alert’s color round the picture, and a post even if tornado warnings or flash flood warnings are switched off (still only for the counties you chose). By default they are posted at once, without waiting for your click and without counting toward the posts-an-hour limit, because minutes matter; switch Post these at once off to have them wait like any other post. If a warning you already posted becomes one of these, AtmoDeck makes one new post of the urgent kind (a comment would not tell anyone), once, and later comments go under it. That is the only case in which one alert is posted twice.
12.9 Team approval
Team approval lets producers approve the waiting posts from their own computers or phones. Under Team approval, switch it on and add each person by name: AtmoDeck makes a private link for each (there is no account to make), copies it for you to send, and shows when each was last seen. A person who opens their link sees what is waiting, with the picture and the words; they can change the words and press Approve and post or Reject, and a sound (if they switch it on) and the tab’s title tell them when a new one comes. The computer running AtmoDeck, which holds your connected accounts, then posts it within a few seconds, and their page shows that it was posted, with a link to the post. The first person to decide has it; anyone else is told who got there first, and a decision made at the AtmoDeck computer shows on their page. Your accounts never leave that computer: only the words and the picture of a waiting post are sent, through the AtmoDeck server, and a post nobody decides within an hour is dropped. Remove a person and their link stops working at once; up to ten people. It needs Wait for my click before posting on, and AtmoDeck open on the computer that posts. Extra-urgent alerts go out at once and are not held for approval unless you switch that off.
12.10 Graphics: pictures of maps for social media
The Graphics tab of the Social Posting page (Broadcast group) makes a picture of a map to post, from what the Weather Service and others say right now, and saves it as a PNG. It is for the days when something is worth a post: a lot of warnings at once, a radar that has stopped reporting, the day's outlook, a drought.
What it can show
Group
Products
Radar
Radar sites not reporting: every NEXRAD site, the ones with no data at the Weather Service for 15 minutes to 6 hours ringed in red, the longest silent listed. A site can be in maintenance or its data delayed, and the picture says so.
Alerts
Warnings in effect (tornado, severe thunderstorm, flash flood: each drawn where it is, with when it ends; untick the kinds you do not want). Watches (tornado, severe thunderstorm). Winter, cold and freeze, heat, fire weather, flood, wind and dust, fog and smoke and tropical alerts: each drawn as the counties it covers, in the alert's own color, counted by kind. Alerts in effect, by state: every kind of alert, each state shaded by how many.
Storm Prediction Center
The Day 1, Day 2 and Day 3 convective outlooks in the Center's own colors, the Day 1 tornado, hail and wind probabilities, and today's storm reports (tornado, wind and hail, as dots, the strongest listed).
More Storm Prediction Center
The biggest storm reports today and yesterday's, mesoscale discussions, tornado reports this month, and the Day 4 to 8 severe outlooks (15% and 30%).
Flood and water
The Day 1 to 3 flash flood (excessive rainfall) outlooks, rivers in flood (minor, moderate and major gauges), and the most rain reported yesterday.
Winter
Winter storm severity for Days 1 to 3 and the snow amount, and snow reported (snowfall and depth).
Fire and air
The Day 1 to 3 fire weather outlooks, the largest wildfires with how much is contained, air quality alerts, and air quality now and tomorrow’s forecast (AirNow).
Heat and cold
The hottest and coldest places right now, record highs and lows set, the high against normal (from 10 in the morning, each climate site’s high so far today from its weather station against today’s normal, asked again each hour; before that, the last finished day), and HeatRisk.
Wind, visibility and radar
The strongest gusts, fog (low visibility), and where it is raining or snowing right now (a dot for each weather station).
Coast and ocean
Rip current, high surf and coastal flood alerts, tropical storms, hurricanes and invests on a sea map (the I symbol for an invest, its chances of developing, and every forecast model's track; the Hurricane Center's own cone is not drawn), the highest waves and water temperature at the buoys.
Climate outlooks
The Climate Prediction Center's 6 to 10 day, 8 to 14 day and seasonal outlooks, temperature and precipitation: where they lean above or below normal, and how strongly.
City forecasts
Forecast highs and the weekend forecast for the biggest cities of the states you choose (up to 40), and the UV index for 58 cities (NOAA and the EPA).
Earth and space
Volcano alert levels, the aurora and geomagnetic activity, and space weather (geomagnetic, solar radiation and radio blackout scales).
Travel and features
Airport delays and ground stops (FAA), today in weather history (the Joplin and Moore tornadoes on their dates, hurricane landfalls, historic outbreaks) and a weather safety tip for the day.
Earth
Earthquakes of the last 24 hours (M2.5 and up) or the last 7 days (M4.5 and up), wildfires of 100 acres or more with their size and how much is contained, and the Drought Monitor.
A warning or watch the Weather Service sends without a drawn area is counted and listed. Warnings drawn as shapes come with a drawn area; watches and advisories are drawn as counties, from the county codes they carry.
More detail: Which states: zoom and crop, Make it yours
Which states: zoom and crop
Press the two-letter buttons to choose any states, or pick a group such as Tornado Alley, Dixie Alley, Gulf Coast, Great Plains, Midwest, Northeast, Southeast, West or Four States. The map zooms to the states you chose and cuts what it draws to them, and the picture says which states in its subtitle. The number and the list count only what is inside them: three tornado warnings in Oklahoma, not in the country. Show the states around them, dimmed keeps the neighbors for context. All states goes back to the whole country, and My area to your own counties (section 12.11). Alaska or Hawaii alone are zoomed on their own; with other states they are placed as the usual inset maps are.
Make it yours
Shape: wide 16:9 (X, YouTube, Facebook), square, portrait 4:5, or story 9:16 for Reels, Shorts and TikTok.
Title: leave it blank for the usual one, or write your own.
Your own bullet points: write up to six, one on each line, and they appear on the side above the list (a long one wraps onto up to four lines). Untick Show the list of places too to keep only your bullets.
Use as a slide: makes the graphic a slide (Graphic: its name among the slides) and adds it as a step to the show you choose beside the button. It is made again, with the newest facts, each time it plays.
Colors: your look’s (Day, Night or Severe, section 12.11), or your own: the background, and the colors of the number and of the markers. Text turns dark on a light background by itself. Reset colors goes back to the usual ones.
Logo, at the top right: your own (the one in Look > Logos), a picture from your computer (up to 1.5 MB; a transparent PNG is best), or none. Tick Put the logo on a plate when it is hard to read on the background you chose.
Save picture puts a PNG in Pictures\AtmoDeck\graphics; Copy picture puts it on the clipboard to paste into a post; Open the folder shows where they are. Refresh the facts asks the services again. Your choices are kept on this computer.
It is a snapshot, and only says what the services say. The picture shows the moment it was made, so post it soon after and make a new one when things change. It does not know why a radar stopped reporting or what a warning will do next, and it is not an official warning product: say only what the picture says. The Drought Monitor is a large file and can take a little while to arrive.
The MJO and the big patterns. Under Climate outlooks, The MJO (Madden-Julian Oscillation): its phase and strength draws its phase now and its path over the last 40 days on the phase diagram. The Arctic Oscillation, the North Atlantic Oscillation, the Pacific-North American pattern and the Antarctic Oscillation each have a picture of their own: where the pattern is now on a five-step scale, its last 15 days, and where the GEFS ensemble takes it over the next 15, told as how many members agree. The big patterns: AO, NAO, PNA and AAO now shows all four at once.
12.11 Graphics: your area and your look
My area (beside All states): the counties you chose in Places (section 6.1). The map is fitted to them with room around them, they are outlined, and everything in their states is shown. It is the first choice unless you had chosen states yourself, and it follows a change of counties by itself. Tapping a state, a group or All states leaves it.
Colors: My look: Day, Night or Severe takes the background from that look's panel color and the number from its accent, read from Look > Colors each time a picture is made, so a change of brand is made once. My own colors, chosen here brings back the color boxes. Colors you had set by hand before are kept.
12.12 Graphics: today’s story, the Right now show and the post
Build today's story looks at the outlooks, the alerts, the tropics, winter and rain, and makes the three or four pictures that have the most to say today (a quiet day gets the ones that always have something to show). Click one to open and change it. Its buttons:
Make the Right now show: the Show page's Right now show (section 13.18), with these pictures after the map and before the futurecast. They are made again with the newest facts when they play. The Right now button of the Show page also takes them, when the story was built in the last six hours.
Post the story…: the first picture goes to Write a post, with the Right now intro (what is happening in your area) and what the pictures are about as the words.
Save all and Download all.
Once built, the story is watched until midnight: every ten minutes the warnings, watches, today's outlook, the tropics, winter and flooding rain are looked at again. An outlook raised a level, or the first warning, rings the bell and puts The story changed over the pictures, with Build it again.
12.13 Graphics: videos, history, and before and after
Make a video: the picture building up, as a short MP4 (about 5 seconds): the areas fade in, the points appear one after another, the number counts up and the town names come last. Post it, or download it.
History: every picture you post, save, copy, download, make a slide or a video, or that Today's story makes, is kept on this computer for 30 days (80 at most), by day. Only shows the picture on screen alone. Open one to see it as it was, make it again with the newest facts, or download it; ✕ deletes it.
Before / after (in History): the earlier picture and the same picture made now, as one picture (stacked for a wide one, side by side for a tall one), each labeled with its time. Post it, download, copy or save it. It is how this morning's outlook is shown beside the update.
12.14 Graphics: posts on a schedule
Schedule posts a picture by itself. Choose the picture on the page, open Schedule and press its button that names the picture, and set:
the time and the days;
Only when it has something to say (weighed as Today's story weighs a picture: an outlook with no risk or no alerts in effect is not posted) or Always;
Ask me first: the bell rings and the picture waits in Schedule with its words, to Post it or Skip;
the words (blank: the title and what the picture found).
It is made fresh at that time with the choices it had when it was scheduled, and goes to the destinations switched on in Alert posting (section 12.2). Run now tries one at once. The Console has to be open; a time missed by more than half an hour is skipped rather than posted late. The last runs are listed under the schedules.
12.15 Graphics: the weather map, air quality, UV, storm recap and scorecard
The weather map and Tomorrow's weather map (Fronts and air): the Weather Prediction Center's fronts, highs and lows, the deepest low and the strongest high named by the nearest big city. The national map keeps to the lower 48.
Air quality right now (AirNow) and Tomorrow's air quality forecast (AirNow): the official AQI of the reporting areas, the worst listed; the map zooms in when several areas are unhealthy for sensitive groups or worse.
UV index (58 cities, NOAA and EPA).
Storm recap: the whole event in one picture (Verification): the tornado, severe thunderstorm and flash flood warnings of the last 24 hours, 2 or 3 days (The event over), the storm reports in and outside them, the tornado reports, the biggest hail and the strongest gust, and the biggest reports listed.
Scorecard: how the forecasts did (two weeks): the highs, the rain, the snow and the week's warnings against the storm reports. Each part says when there is nothing to count yet.
Yesterday's rain and yesterday's snow now keep a two-week record and say how those two weeks went. A day of rain is scored the day after the Graphics page kept its forecast.
More detail
Thirteen more pictures are in the Graphics page: the aurora viewline, sunrise and sunset with the golden hour, the Moon and the dark nights, meteor showers and eclipses, the GOES satellite and lightning pictures, smoke from NOAA's Hazard Mapping System, marine hazards, tsunami alerts, burn-scar and debris-flow flash floods, the biggest temperature swings, rain and snow records, and the wettest places this month. A picture can now be any shape in the place of the map.
Day 2 and Day 3 of the Storm Prediction Center are on the Graphics page beside Day 1: the chance of a tornado, of damaging wind and of large hail for tomorrow, and for the day after the one chance of severe weather (the Center draws a single chance for Day 3, not one for each threat). Each is drawn the way Day 1 is, with the highest chance as the big number.
A picture that has nothing to do with the map (the Sun and its flares, space weather, the Moon, meteor showers, a safety tip, a scorecard) has a graphic of its own in place of the map: the reading on a colored scale, the Moon as it looks tonight, a poster of the words, or the list as large cards. A picture that draws on the map keeps its map.
The card with the big number takes the color of what it says: a C-class flare is yellow, a 10% tornado chance is the color the Center gives 10%. The list of pictures is grouped by subject, the Storm Prediction Center first, with the space pictures together under Sun and space weather, the stars under Astronomy, the satellite and lightning under Sky and satellite and the volcanoes, earthquakes and drought under Earth hazards.
12.16 A clip of the map for social, in one click
Clip for social (vertical), at the top of Map Studio's Export menu, makes a phone-sized video of the loop in one click: the loop that is on the map, twice round, as an upright 1080 by 1920 MP4 with the header, the legend and the Powered by AtmoDeck badge. When it is made, Social Posting opens with the clip attached and a line to start from (the product and the time); choose where it goes and post.
The clip is taken from the upright Output, so the header and legend are laid out for a phone and nothing is cut off. If your second Output is on, it is that one, as you have laid it out. If it is not, AtmoDeck opens one off the screen for the length of the clip, with the map alone in it, and closes it again; nothing appears on your screen or on air.
The first Output is not touched: what is on air keeps playing.
The file is also saved in Pictures\AtmoDeck (its name starts with social-).
The other exports of the loop (MP4, GIF, a live recording) are below it in the same menu (section 18.17).
12.17 Verification: what was warned and forecast, and what happened
The Graphics tab of Social Posting has a Verification group: pictures for the day after that set what was warned and forecast beside what happened. Like every graphic they can be posted, used as a slide or put in a show.
Yesterday's warnings and what was reported (and the same for the week): the tornado, severe thunderstorm and flash flood warnings on the map with the storm reports. A warning that had a report inside it is filled; one with none yet is an outline. Reports inside a warning are white, reports with no warning are pink. The numbers say how many warnings had a report, how many reports were inside a warning, and the average lead time. A warning with no report is not called a false alarm: reports are preliminary and keep arriving for days.
Yesterday's forecast and what happened: for your first ten cities, the high and low the 5-day forecast gave the day before against what the nearest Weather Service station measured, with the average miss and, once there are more days, the share of highs within 3 degrees over two weeks.
Yesterday's snow: forecast and measured: the snow forecast the day before against the national snowfall analysis at each city, for the cities where snow was forecast or fell.
A forecast can only be checked if it was written down when it was shown, so AtmoDeck keeps a forecast journal: every day the Output is open it notes tomorrow's forecast for each city, and the day after it puts the measurement beside it. The journal is kept on this computer for 35 days. The forecast and snow pictures therefore have their first comparison the day after AtmoDeck has run for a day; until then they say so. The warnings picture needs no waiting.
Everything is free public data: the Weather Service's warnings, station reports and storm reports, the Iowa Environmental Mesonet's matching of warnings and reports, and NOHRSC's snowfall analysis.
13. The Show page and blocks
A block is the map as it is, saved with how it should play. A show lines blocks, slides and intros up like a broadcast rundown and plays them by the clock or step by step.
13.1 Blocks: save the map as a still or an animation
A block is the map as it is now with how it is to play on air. Open Save block in the top bar of Forecast Builder or Archive mode (in Live Map: Library > blocks, section 18.7) and fill in the form:
Plays as: One picture holds a still for the seconds you give; An animation plays the loop (the radar and its layers, the forecast builder’s timeline, or the archive window) the number of laps you give, holding the last picture of each lap for the pause you give.
Time (Live Map): Now (the loop of the radar), Now, carried on into the forecast, or Forecast only (a model product on the map). Speed sets how fast the loop plays.
Camera: stay where the map is looking, or tour a group of viewpoints (save two or more under View first). Set the time to fly between stops and the pause at each stop. On an animation, Laps at each stop makes the tour wait at every stop until that many laps have played before it flies on.
Forecast Builder holds the keyframe that is selected, or plays its timeline; Archive blocks keep the window, radar, product and overlays set in Archive mode.
Try it on the output plays the block without saving it; Let go puts the map back. Saved blocks are listed under the form with their length, and can be played, Updated from the map as it is now (their timing stays) or deleted. There can be 60.
Shows saved by an older version of AtmoDeck are made into blocks, and the run of show into a show, the first time the Show page opens.
One map position for the blocks. A block’s Position button puts it where the map is looking now (position, zoom, tilt and turn) and a Viewpoint picker puts it at a view saved with View > Save this view. Give every block this map position does it for all blocks, and a row of saved viewpoints, listed by group, puts every block at one (for example Statewide or Regional). The Slides menu has Give every slide this map position. What each block or slide shows, and its look, stay its own. Opening another block while one is being edited saves the changes first; Cancel editing still drops them.
13.2 Editing a saved block
A block that is saved can be opened again and changed:
Edit, on a block in the Blocks menu (Saved > Blocks), or a click on a block in the Library, puts the block's map back on the preview, in its own mode (Live Map, Forecast Builder or Archive), and its name, timing, view and pop-ups back in the form. Change the map, the products or the settings.
Save changes keeps the changes in the same block, so every show that has the block plays it as it is now.
Save as a new block keeps the block as it was and saves the changes as another one.
Cancel editing stops without changing the block.
Update is the quicker way when only the map has changed: it puts the map as it is now into the block and keeps its timing and folder.
13.3 A block’s header says what the block shows
While a block plays in a show, the map's header is titled by what the block shows: the name of the product on the block's own map (the radar product, the satellite picture, a data layer, or the outlook when the map is of an outlook alone). It does not take the title Map Studio happens to have at that moment.
Header title, in the Save block form, is for your own words: type a title and the block uses it instead. Leave it empty for the product's name.
Blocks you saved before take the product's name by themselves; nothing needs saving again.
The header's look (its colors, font, logo and layout) is still the station's, set once in Map Studio.
To rename a product for the header, use Header and legend > the product names at the bottom of the header's list.
13.4 Blocks: folders, recorded moves and stills
Folder. Type a folder name when you save a block (the ones you have are offered). The saved blocks are listed under their folders, a search box appears once there are more than five, and the Show page lists them under the same folders with a search box of its own.
Follow moves I record. Under Camera choose it, press Record my moves, then pan, zoom and tilt the map in Map Studio the way the block should move, and press Stop recording in the Blocks menu (Saved > Blocks). The wait before your first move and after your last is taken off. On the Output the camera is put where you started and carried through your moves in the time you took, then held for Pause on the last. Up to ten minutes are kept.
Still. Each saved block has a Still button: the block is played on the Output and a clean screenshot of it is saved in Pictures\AtmoDeck. Save a still of every block does them all in turn.
13.5 The Show page
The Show page (Broadcast group) is a rundown like a broadcast switcher’s. A show is a list of steps: a block, a slide, an intro, or an intermission.
Add a step with + Add to show… (see Adding steps: the Add to show window): a block, a map product, a layer set, a slide, a graphic, a video, an Intro (click it to type a title and a line of your own) or an Intermission (everything is let go and the Output shows the radar map; 0 seconds waits for you to press Next). Drag a row, or use the arrows, to reorder; the circle-slash leaves a step out this time.
Each row has Plays (a block plays as long as it takes, which you can overrule). Click a step’s name for its panel: its words, block or slide, a cue note for the presenter, Pause after (blank is the show’s pause), Transition into it (cut, dip to black, wipe, push up or iris; blank is the show’s) and Moves on (by itself, or waits for you) (section 13.6).
On at is the clock time each step will play. The footer gives the running time and when the show ends. While the show runs the times follow what really happens: a step that runs long moves everything after it.
Plays (in Show settings): By itself (auto-pilot) or Step by step (a key). Starts: when you press Start, or at a time of day (it arms and goes on air then). Options for an intermission at the end (back to the map) and to start again when it ends.
While it is on: Next (Space), Back, Hold (freezes the timers) and Stop. The Keys boxes (Show settings, one fold deeper) set keys that work anywhere, even while OBS has the focus (Control+Alt+N, B and H to begin with). The phone remote has Next, Back and Hold. Rehearse runs the clock without touching the Output.
Auto-pilot is folded at the foot of this page: choose a show to play during the hours you set; it starts again by itself when it ends and gives way to a warning, resuming after the quiet minutes you set. The Dashboard shows a small card with what is on and the Next button.
Slides only play in the wide shape; a show on the vertical second output shows the map under them.
13.6 Running a show: the on-air strip, Manage, Show settings and a step’s panel
The Show page keeps what you need on air in front and folds the rest away.
The on-air strip stays pinned at the top of the page while the rundown scrolls: the Program and Preview monitors, what is on and what is next with their cue notes, and Start the show, Rehearse and Break in (while it runs: Next, Back, Hold and Stop). A step with no small picture of its own (an intro, a slide, a break) shows its sign and its words on the monitor; an empty monitor says Off air or Nothing next.
Manage, beside the show's name, holds Duplicate, Rename, Save as template and Delete.
Show settings is one line that says how the show is set (by itself · pause 2 s · Dip to black). Open it for Plays, Starts, End on time, the pause between steps, the transition, the intermission at the end and Start again. One fold deeper, Voice, stinger, break-in, clicker and keys holds the show's voice, the transition and break-in pictures, the stingers, what Break in shows, the map box, the presenter clicker and the keys.
Each row shows the step, how long it plays, the time it goes on (On at), the arrows, the circle-slash that leaves it out this time and the cross that takes it out. Click a step's name to open its panel: its words, block, slide or camera, the cue note, Pause after, Transition into it and Moves on; More for this step holds the rest (its background, its sponsor, its voice, when it plays, the map box, the title strap, optional) and Add a step after and Duplicate this step.
Auto-pilot is folded at the foot of the page.
The step on air is known by its identity, so moving, adding or taking out steps while a show runs still plays the right step next (a step taken out while on air plays out and the show goes on after it). A block step's own length is honoured, a block deleted in Map Studio is passed over (and the report says why), and the picker, Manage and the rows work on the show chosen at the top of the page.
13.7 The schedule: shows by the clock
The schedule: shows by the clock. Under the rundown, above Auto-pilot, the Show page has a Schedule fold of up to 24 time slots. A slot is a show, a time from and a time to, and the days of the week it plays on; the arrows move a slot and the cross takes it out. While Play the shows by the clock is on, each slot's show starts when its slot begins and plays again from the top as soon as it ends, for as long as the slot lasts. When the slot is over, the next slot's show comes on over the one on air with its own first transition; when no slot follows, the show stops and the Output goes back to the map. Turned on with no slots, the switch starts one for the show chosen above, from the next hour for two hours, to change as you like.
A slot that runs past midnight belongs to the day it starts on, and one from a time to the same time is the whole day.
Where two slots overlap, the one that started last plays, and the longer one comes back when it is over; of two that start together, the first in the list plays.
A show you start, stop or change by hand during a slot is left as it is until the next slot begins. A break-in, or a warning that has the Output, is waited out, and the change that waited comes on when the warning lets go.
While a slot is on, Auto-pilot neither starts nor stops its own show. A slot whose show was deleted plays nothing and says so in the as-run log.
The fold's line says whether the schedule is on, which show plays until when, or what is next, and a Coming up line lists the next four changes. The schedule is saved with the map settings.
Each time slot plays once or repeats. A slot that plays once takes its end time from the length of its show. A slot that repeats runs until the end time you set, with the break you choose between plays, and says how many plays fit. While a repeating show waits, the Show page counts down to its next play. The length does not include time a step waits for the Voice, so a show that plays once can finish a little after its end time.
13.8 The presenter’s clicker and the Presenter segment
A presenter's clicker sends Page Down, Page Up and, from its blank-screen button, a full stop. Turn on Presenter clicker (Show settings, one fold deeper) and, while a show is running, Page Down steps to the next step, Page Up goes back one, and the full stop takes the picture to black and back, from any program (OBS, a browser), like the show's other keys. When the show stops the keys are given back, and a picture left black comes back. On the Show page itself the three keys work at any time. The black is a fade over everything on the Output.
Presenter segment, under + New show, is a station's weekly weather segment in its usual order: rain totals, the outlook, the radar, the future radar, the pattern aloft, a live camera, the day planner, tonight's lows, the event forecast and the 7-day. It takes your own blocks by their names, your slides and your first camera; the map steps you have no block for are made from the product library with the map as it is, and saved in the Library folder Made in the show. It plays by hand, one cut at a time, for the clicker.
13.9 Show tools: the check, ending on time, conditions and breaking in
The check. Above the rundown the page says Ready, or lists what would go wrong on air: a block that was deleted, a tour whose group now has fewer than two viewpoints, a block of recorded moves with none, a slide that has been taken out of the slides, an intermission of 0 seconds in a show that plays by itself, a step that waits for you in a show that repeats, a show that runs past its end time, the radar map switched off on the Output. Click a line to open that step. Start asks before it plays a show with something to fix.
End on time. Tick End on time and give the time. A show that is too long first leaves out the steps marked Optional (click a step to mark it), the last first, then shortens its pauses; one that is short lengthens its pauses (30 seconds each at the most). It is worked out again at every step, so the times in the rundown and the footer (Fits, or by how much it runs past) stay true while the show plays.
Conditions. Click a step and set Plays: always, only while a warning is in effect, only when none is, only while it is raining or snowing at your first city (checked every ten minutes), only while it is dry, on weekdays, at the weekend, in the morning, or in the afternoon and evening. A step whose condition is not met is left out and shows left out now in the rundown.
Break in. Choose what it shows under Break in shows: a block, or the radar map as it is. The Break in button (also B on the page, Control+Alt+X anywhere, the Dashboard card and the phone) cuts the Output to it at once and holds the show. Press Return and the show plays the step that was interrupted again from its start; Next goes on to the step after it instead.
Program and Preview. The two pictures at the top are the block that is on and the one that is next, with their cue notes under the names. The pictures are taken from the map when a block is saved or updated (they are kept on this computer, not in a backup).
Title strap. Click a block or slide step and tick Title strap on the Lower Third. Type the title (the name of the step is never used: with no title typed, nothing is shown) and, if you want one, the label over it. It is shown for as long as the step plays, where the Lower Third widget is in your layout, even when the Lower Third is switched off.
Map box. A step can move the radar map for as long as it plays: the whole picture, the left, the right, or a corner (over the slide on a slide or intro step). Map box now at the top does the same by hand. Nothing is saved: when the show lets go, or a layout is applied, the map is back where your layout has it. Boxes are for the wide shape.
New shows.+ New show offers an empty show, four ready-made ones (Morning, Afternoon, Evening, Severe weather) built from the blocks and slides you have, and your own templates. Save as template keeps the show that is open as one.
The report. When a show ends or is stopped, Last run at the bottom lists each step: when it came on, how far from the plan, how long it played against how long was planned, what was left out and why, and the break-ins. Copy it or Save as a file.
The presenter’s page. On the phone remote, Open the presenter’s page shows what is on with a countdown, the cue note, what is next, and Back, Hold and Next.
13.10 Video files as steps
Video file in + Add to show… on the Show page adds an MP4 or WebM file as a step. It is copied into AtmoDeck, fills the Output until it ends (or for the length you set), and the check before the show warns you if its file is gone.
13.11 Graphics, your own transition picture and pop-up slides
Graphics as steps. On the Graphics tab of Social Posting, Use as a slide adds the picture to a show; + Add to show… > Graphics adds one you saved. It is made again, with the newest facts, each time the show plays it. Your own transition.Transition picture takes a PNG, JPG, WebP, GIF or SVG; the Your picture transition slides it across the screen when a step changes, and Wipe and Push use it in place of the colored bar. Pop-up slides in a block. Right-click a spot on the map and choose Block pop-up (current conditions, hourly or 5-day forecast); Save block lists them with when they come up and how long they stay. Ready before their turn. While a slide, intro, video or graphic is on, the next radar block is loaded behind it.
13.12 Going to a step, a voice for each step, the break-in picture
Four things on the Show page that make a show easier to run live.
Click a step to go to it. The number of each step is a button (it turns into a ▶ when you point at it). While the show runs, clicking it cuts to that step at once and the times work out again from there; when the show is not running, clicking it starts the show at that step. A step that is left out says so instead of playing.
The voice, for each step. Open a step and choose Voice: As the Voice page says (its own choices apply), Reads this step aloud (a slide as it is read on air, an intro its title and line, a block its cue note; it reads even if the Voice page has slides off), or Silent on this step. Warnings are always read.
A picture for breaking in. Next to Break in shows, Break-in picture takes its own PNG, JPG, WebP, GIF or SVG that slides across the screen when you press Break in. It is separate from the transition picture of the steps; with none, a break-in cuts at once.
Stinger transitions. Two more choices for the Transition of a show or of one step. Stinger video plays a video of your own over the picture and makes the change under it at the cut (the middle of the video, or the second you set under Cut at). A WebM with transparency (VP8 or VP9 with alpha) keeps its see-through parts, so the show shows through; any other video plays as it is. It can be up to 10 seconds and 150 MB, and a sound in it is played. Branded stinger needs no file: choose one of six ready-made animations (Slanted bars, Slash, Ripple rings, Tile burst, Split curtain or Liquid wave), the three colors it is made of, and the logo (your station logo, none, or a picture of your own). Preview plays either one over a checkerboard. A stinger that cannot play falls back to a dip to black.
A graphic fills the Show widget. A graphic of a show is drawn in the space of the Show widget of your layout. Right-click that widget in edit mode: A graphic in a show chooses whether its background covers the whole screen or this widget only (the rest of the layout stays on air around it).
The slides' content and background in two boxes. Look > Layout & Widgets has Pick where content of slides goes (the Show widget: the header, cards and words of a slide) and Pick where background of slides goes (the Slide Background box: the station's or a step's picture, a canvas slide's own color or picture, and a camera behind the slides). Each opens Edit Mode on the Output with that box picked, to drag and resize. Beside them, Background: Fill the box covers the whole box and Background: Crop shows the whole picture with black where it does not fill the box; the same choice is in the box's right-click menu. Until you place the background box it sits where the Show is, so a layout looks as it did. A picture or clip of a slide you export keeps its background on the slide.
A step’s panel has Spoken by, the voice for that step, and Words to say, which are read instead of the words the Voice would choose. A block step also has Camera: choose a group of two or more viewpoints and the block runs through them. This changes the block itself, so every show that uses the block gets it. The Add to show window offers the same choice when adding a map product.
13.13 A step presented by a sponsor
Each step of a show can be Presented by one of your sponsors (the Sponsors of Content > Content Widgets), in More for this step. Its logo sits on white at the end of the header of what is on air: the map's header for a block, the slide's header for a slide, and a box in the top right corner for an intro, a camera, a graphic or a video (or when the header is off). The sponsor log counts the time the logo really shows, and the sponsor report lists every sponsored step with who presented it, for all sponsors or for one with its total.
13.14 Adding steps: the Add to show window
Everything that can be a step goes into a show through one window: + Add to show… under the rundown. Each row of the rundown also has a + button that opens it for the place right after that step.
Where it goes. The Goes list at the top puts the new steps at the start, at the end, or after any step of the show. It starts at the end, or after the step you have open.
Your blocks. The blocks you saved in Map Studio, with their small pictures, how long each takes, and their folders as buttons above the list. Search finds a block by its name or folder.
Map products. The same library as Map Studio’s Add product: radar, satellite, outlooks, weather models, mesoanalysis, alerts and the rest, with the same stars (Favorites) and Recently used. Pick one and the block is made for you, from the map as it is now, and added as a step: no trip to Map Studio. Plays as chooses a loop (and how many times) or one picture held for some seconds; What suits it loops radar, satellite and model pictures and holds the rest. The new blocks are kept in the folder Made in the show, so they are also in Map Studio and can be used again. Your live map and the Output are not changed while you choose.
Layer sets and Map slides. A saved layer set is laid over the map (the view stays where it is), and a saved map slide keeps its own view; each becomes a block.
Cameras. Every camera of Content > Webcams, with its picture when it is a still. A camera becomes a step that fills the whole picture with the live view, with its name and a LIVE tag (a box in the step turns them off); it plays 15 seconds unless you set another time. To put a camera behind a slide instead, see A camera behind a slide, and a delay before its elements.
Slides, Graphics, Video file, Intro and break. The forecast slides, the graphics you made, a video file of your own, an intro with words of your own, and an intermission.
Several at once. Click a card to tick it (the number says the order they go in); Add and keep open adds them and stays open for more, Add steps adds them and closes. A double click adds that one at once.
13.15 A camera behind a slide, and a delay before its elements
The picture behind the slides can be a live camera, and the slide’s own elements can come in a moment after it.
A camera as the background. On the Slides page, Background Image lists Live camera: … for each camera of Content > Webcams. Choose one and it fills the whole picture behind every slide, under the header, city name and cards, and keeps running from one slide to the next. The usual photo stays under it, so a camera that does not answer leaves the photo. A social video export never uses it.
A delay before the elements.Delay before the slide’s header and cards come in (0 to 60 seconds) lets the background show alone first; then the header, the city and the cards come in as usual. 0 brings everything in together. The delay is part of the time the slide is up, and it works with any background.
In a show. Open a slide step (or an intro) and choose its Background (as Slide Setup has it, or a camera) and Elements come in after (blank is the usual delay). They apply to that step only, and the usual setting is back when it ends.
13.16 Map slides and cuts to a slide
Slides.Library > Map slides (section 18.7) saves the map exactly as it is (where it looks, the radar, the layers, the look) as a named slide with its own seconds and a Loop switch (off holds a still picture of the newest radar, or of the forecast hour that is now). On the Slides page, Add slide has "Map: name" for each one, and it shows like any other slide. Every time it comes up it shows the newest radar or the newest model run of whatever product it holds. The map is loaded behind the slide before it, so it is ready when it appears; between two map slides the change uses a plain backdrop for a moment. A slide made from a forecast model needs the internet when it is shown. A slide also remembers which custom layers (section 23.9) were on and how each looked; a layer added later is off in an older slide.
Slide pictures. On the Slides page, every playlist item has a camera button, and one button saves a picture of every slide as a 1920 by 1080 PNG in Pictures\AtmoDeck. Map slides are skipped there (the export window has no map): use the camera in Map Studio for those.
Cut to a slide. Give a slide a hotkey (for example Ctrl + Alt + 1) and pressing it cuts the Output to that slide, over everything, even while a show plays. The same key again, or the release key, puts things back. The Cut and Back buttons are also in that menu, and the phone remote has one button for each slide.
Slow turn. In the View menu, Slow turn around a point turns the camera slowly round the middle of the picture, a point you choose, or the tropical storm shown, once in 20 seconds to 10 minutes, either way. It turns the preview and the output together and keeps the point where it is on the screen, which makes video that circles a storm. A touch of the map in the Console stops it. It is saved with a map slide, a block or a show, so a slide made with it on turns when it is shown.
13.17 One map look for every slide and block
Give every slide this map look, in the map slides menu, copies the look of the map you have now onto every saved slide: the base map, its colors, the borders and county lines, the roads, the place names and their fonts, the zooms they show at, the grid, the globe, the sky and the night. Where each slide looks, its radar, products and layers, its header and its time on screen stay its own. It asks first, and one step of the map's Undo puts the slides back.
The Blocks menu (Saved > Blocks) has the same button for the saved blocks: Give every block this map look.
13.18 Right now: a show made from the weather, and the Voice for a whole show
The Right now button on the Show page makes a show from what the weather is doing this minute. It reads the warnings in effect in your monitored states, the river gauges around your home city and the Storm Prediction Center's outlook for it, and writes a show of three to five blocks with an intro, most important first:
The warnings: the most serious one in effect, the map fitted to it and to the others of its kind near it. A warning in your monitored counties comes before a stronger kind elsewhere.
The storm: a closer look at that warning's storm, for a tornado, severe thunderstorm or flash flood warning that has a shape.
The river: the gauge in the worst flooding, now or forecast, within about 280 miles, with its gauge story on the map (section 22.8).
The outlook: the day 1 severe outlook, when your home city is in a risk area.
The radar across your region: first on a quiet day, and whenever there would be too few blocks. A quiet day also gets the satellite.
What is next: the HRRR's forecast radar as one flowing loop, a picture for every hour of the run, smoothed, three times round.
The blocks use the local radar: the NEXRAD nearest to what each block shows, not the national mosaic (only the futurecast, a model's picture, is not one radar). Every other overlay and extra layer you had on is left off in them. Each step has a line for the Voice, written from the warning, the gauge or the outlook itself.
What it makes is an ordinary show named Right now with the time, and ordinary blocks in a Right now folder: trim it, reorder it and add to it like any show. Pressing the button again replaces the last one; a rundown you have renamed is yours and is kept with its blocks. A source that does not answer within eight seconds is left out, and the message says which.
Voice for a whole show. Every show's options have a Voice choice: As each step says, On: read every step (an intro its words, a block its cue note; a step set to Silent stays silent), or Off for this show.
On the Output, a gauge story that a show brings up is put in the part of the map your layout's widgets leave free, like the story boxes.
14. Slides: forecast slides in a show
The forecast slides (7-day, current conditions, day planner, severe outlook and more) are steps of a show on the Show page. Slide Setup holds what every slide shares: the location, the background, the data list period, the numbers you override and the Look.
14.1 Putting a slide on air
On the Show page, + Add to show… > Slide adds a slide as a step. The first row of every step has Presented by (a sponsor from Content, whose logo goes in the header) and Background (As Slide Setup has it, Auto, the four mood photos, a picture of your own, or any live camera). A slide that shows several cities (current conditions, the day planner, the commutes, the lists and Highway Travel) has a Cities row: add up to ten, from your Content cities, a big U.S. city, or any town typed as Ames, IA. With none chosen it uses your area’s cities. The same Cities row is in the Slide Builder. The Voice reads a slide when its step’s voice is on.
14.2 The Slide Builder page, and where the pages are
The Slide Builder page (in Build, after Map Studio) makes slides of your own from any of the slide templates, and from the pictures of the Graphics page. + New slide and Template list the templates in groups: the forecast slides (7-Day, 3-Day, Weekend, Today & Tonight, Current Conditions of four cities, Right Now, the Weather Story and the rest), then Graphics: and the Graphics page's own groups.
Each slide has its own name, its own city (one of Content > Cities, or Slide Setup's; a slide of several cities has a Cities row instead, up to ten, and with none it uses your area's), its own title, the line under it and the city line. A forecast slide names its city under the title.
Automatic is the forecast as the template shows it each time the slide plays, for the slide's city. Your own numbers and icons is a table you fill in: the days (day, high, low, icon, words, rain chance, wind), the four cities (name, temperature, icon, words, humidity, wind, direction, pressure), the panel (temperature, humidity, dew point, wind, direction) or the story's headline and three points. An icon is chosen from a grid of 22; Fill from the forecast starts the boxes from today's forecast to change by hand, and an empty box shows --. A list slide (rain, snow, wind, low temperatures and the rest) can have your own ten places and values, rows 1 to 5 and 6 to 10. An intro takes your own words and the line under them. A graphic slide has its own title and its own words beside the number, and its picture is made from the newest facts, as a show's graphics are. A slide that only shows its own facts (the Almanac and the like) says so and has no Automatic or Your own switch.
Slides are saved as they are changed (500 at the most) and are called My slide: name (My slide: folder / name in a folder) in every list of slides, so a step of a show and Social Posting can have them. Preview makes the picture as an exported slide is made, Download saves it as a PNG (making it first when the last Preview is old), Add to the show puts it at the end of the show chosen beside it, and Duplicate and Delete (press twice) are there too. A slide deleted from a show says so where it was.
Folders. The Folder box beside the name puts a slide in a folder: choose one you have, or type a new name (empty: no folder). The list on the left shows the slides of no folder first, then each folder under its own header, which folds it shut or opens it. On a slide of a folder, Add the folder puts every slide of the folder at the end of the chosen show, in the order they are listed, and says how many did not fit when the show reaches its 80 steps.
A team’s sync (Keys & Backup > Sync, or a team) carries the slides, their folders and the Event Forecast slide to the other computers, as a part of their own. Both computers need AtmoDeck 2.7.12 or newer; an older one drops the slides, and a show’s steps there say the slide was deleted.
More detail
A blank canvas. The template Blank canvas (put anything anywhere) is a slide of your own design. Add puts in words, a box, a circle, a line, a weather icon or a picture. Drag a thing to move it and its corner and side handles to size it (Shift keeps its shape); the arrow keys nudge it (with Shift, 10 at a time), Ctrl+D copies it, Delete takes it out and Ctrl+Z and Ctrl+Y undo and redo. Click a thing, or choose it under Thing, and the boxes under the slide set its place, size, turn and see-through, its colors (one, or two as a gradient, and a border), corners and shadow, the words' font, size, weight and alignment, and which goes in front. Snap lines things up with the middle and the edges of the slide.
The Background is the station's, one color, two colors at an angle, or a picture of your own; The station's header puts the usual header over it. Words can name the forecast for the slide's city: {temp}, {sky}, {day1}, {hi1}, {lo1}, {pop1} and the rest (day 0 is today, up to day 7) are filled in every time the slide plays, and a weather icon set to Forecast shows that day's sky. The slide goes on air, into a show plan, the bucket and Download at 1920 x 1080, just as you placed it.
Ready-made pieces. Next to Add, Ready-made puts in any part of the usual slides, drawn in your slides' colors and font from Slide Setup: the station's header, a day of the forecast, three or seven days, today's high and tonight's low, a message box with three points, the city's current conditions, the Right Now side panel, a row of a list or a list of ten, the intro band and your logo. A piece moves and sizes as one: drag it, or pull its corners. Its panel sets where it is, the day of the forecast it shows, its font and its colors (change one and every part with it changes), and Take apart makes its parts separate things. Click a piece again to change one part of it alone, such as one word. The station's header shows the real header in the editor, named for the slide unless the slide has a title of its own.
Colors, and copying them. Every thing on the canvas has its colors in its panel: a fill or a box behind it (words, weather icons and pictures too), a second color for a gradient, a border, and the words' color. Copy colors takes the colors of the thing or piece chosen; choose another and press Paste colors (Ctrl+Shift+C and Ctrl+Shift+V do the same). From one thing to another the colors go over exactly; onto a piece, each of its colors becomes one of the copied ones in turn.
Your templates. The Templates row saves the thing or piece chosen (Save the chosen) or the whole slide with its background and header (Save the whole slide), under the name you type. Choose one in the list to Put it on this slide, Make a slide of it in My slides, Download it as a file, or Delete it (press twice). Load a file… brings back a downloaded template, on this computer or another. Your templates are also at the end of the Ready-made list, and they go with your team's slides through the shared bucket.
A photo or a live camera behind it. The Background list has, besides the station's picture, one color, two colors and a picture of your own: A photo of the station's (blue sky, sunset clouds, dark storm or night city, your own where you set one in Background Photos) and A live camera, one of the cameras in Content › Webcams, which plays behind the slide on air. Put its name on adds the camera's name as words at the bottom of the slide; type {cam} in any words to show it anywhere. A downloaded picture of the slide has a snapshot of the camera at that moment behind it.
Any Google font, words that fill their box, and a dropper. The Font box of words takes any Google Fonts family: pick one from the list or type its name (Station is the slides' own font). The font comes from Google Fonts the first time it is used, on air and in a downloaded picture too; with no internet the words are in Inter. Size a text box by a corner or side and its words are made as big as fit in it. Every color swatch in AtmoDeck opens the color box, which now has a dropper beside the hex code: click it, then click anywhere on the screen, a slide, a camera or a photo, to take that color (Esc stops it).
Blank templates. Six empty layouts on your station's background, to fill with your own words, pictures and colors: Header only, Title and words, Picture and words, Two columns, Three numbers and Full picture with a band. They are listed under Blank templates in + New slide from a template…, and under Slides in the Show picker, which also lists your own whole-slide templates. Each is a blank canvas slide of 1920 × 1080, so it fills the Show space of your layout exactly as the built-in slides do. Picked in the Show picker, it is saved with your slides and added to the show as a step, so it saves and reopens with the show. A picture box you have not filled yet shows only in the editor, never on air.
Where the pages are. Slides play as steps of a show, and what they share is on the Slide Setup page in the Broadcast group, after Show. Building a slide of your own is on the Slide Builder page. Voice and the Teleprompter are folds at the foot of the Show page that open and close; their old names, the search box and a link still lead to them, with the fold opened.
14.3 Slide Setup
Main Location: the city of the single-city slides. It defaults to your first configured city.
Background Image: Auto (time and weather), a fixed Dark Storm, Sunset Clouds, Blue Sky or Night City, or a live camera; a step’s own Background wins over it.
Data List Time Period: how far back rainfall and temperature lists look (24 hours, 2, 3 or 7 days).
Custom Data Overrides: the headline and three bullets of the Custom Weather Story.
Look: typography and region name, colors and boxes, logos, replacement background photos for the four mood categories, and where the slide content sits.
Slides wear Map Studio's header. The slides' header is the map header itself: the same accent bar, logo, title, line under it and city, drawn by the map's own style, so the two look the same. The colors come from Map Studio > Header (or the broadcast's, when the header matches the broadcast), the colors set in Look > Colors, and the font, weight, size, corners, logo, logo box, accent bar, time box and width. A warning slide wears the header's alert look, red with a glowing title, for as long as it is in alert mode. Slide previews and exported pictures wear the full header too.
14.4 How the slides use your area
the slides follows the cities, counties and area name you set on the Places page:
Regional slides (current conditions, day planner, commutes, lists and the severe outlook) use your first ten cities, in your order. The four-city slides use the first four.
Region titles use your area name. If you left it blank, the name is built from your states (for example "TEXAS REGION"). An untouched default setup keeps the original "FOUR STATES REGION" wording.
The Marine and Lakes slide uses the built-in lakes that are within about 100 miles of your cities. If none are that close, the slide shows a short "no monitored lakes" message; remove the slide from your playlists in that case.
The Top Right Region Name box in the slides styling section overrides the region name shown at the top right of the slides.
14.5 The slides
Group
Slides
Intros
Forecast Intro Animation; Forecast Intro ("Your Weather in :60")
Forecasts
7-Day Forecast; 3-Day Forecast; Weekend Forecast; Today and Tonight
Multi-city
Day Planner (next 8 hours); Current Conditions; Morning, Afternoon and Evening Commute; Highway Travel
Side panel
Current Conditions (side panel, over a camera): the temperature, humidity, dew point and wind for the home city
Severe weather
SPC Severe Weather Outlook; Live Auto Advisories
Lists
Rainfall Totals; Highest Temps
Live cameras
Live Camera (rotates through your cameras); Live Camera: name
Lifestyle and data
The Almanac; Air Quality; Power Grid Status; Marine and Lakes; Agri-Cast (Farming); Car Wash Index; Skywatch Report
Custom
Custom Weather Story
Live Auto Advisories pulls the top active alert for your monitored counties. The Air Quality slide shows the U.S. air quality, ozone and fine particles (PM2.5) for the slide’s city, each as a word (Good, Moderate…) with its AQI number; a card with no reading says NO REPORT rather than a number.
The Ice Accumulation List slide ranks your regional cities by the ice their NWS office forecasts for the day, from the office’s own forecast grid, beside Rainfall and Snowfall Totals.
14.6 The Event Forecast slide
The Event Forecast slide is one event at its own times, the way a station shows Friday night's game: a row for each time (KICKOFF, HALFTIME, 4TH QTR) with the sky and the wind, the temperature large on white and the icon, on a stadium at night or the slide's own background.
Set it in Slide Setup > Custom Data Overrides: its title, the day (today, tomorrow or the next of a weekday; tonight's event shows until an hour after its last time), the city (one of your cities, or the area) and two to four rows, each a name and a time. Ready-made events: football, game day, this evening, trick-or-treat and a parade.
The numbers are the hourly forecast for each time. An event past the end of the forecast says so instead of guessing.
14.7 Where the forecast numbers come from
Today and the next three days, and the conditions of now, are the local NWS office’s own forecast grid (NDFD, from api.weather.gov): the temperature, feels-like, humidity, dew point, wind and sky. The days after are the National Blend of Models. Pressure, UV and air quality come from the weather source, since the grid has none. The sky and wind are written as the NWS writes them: Mostly Sunny, and the wind with its direction and range, SSE 3 to 7 MPH; for the office’s days the words are its own.
14.8 Where the slide content sits
In Slide Setup > Look you can put the header, city name and cards in a corner, along an edge or in the centre, bigger or smaller; the background photo or video keeps filling the picture.
14.9 Highway Travel from your own area
The Highway Travel slide finds the interstates and US routes round your own area from OpenStreetMap (asked once, then kept for a week), reads the weather at points along each, and shows for each route its towns, the temperature range, the worst place, the wind and a rating.
14.10 The Almanac
The Almanac slide fills itself in from the nearest NOAA climate station (the Applied Climate Information System): yesterday's high, low and rain against normal, the rain this month and this year, and the snow this season, from the nearest station with thirty years or more of record (an airport's first); the normals are those of 1991 to 2020. The station is named under the slide. Sunrise, sunset, the moon and the length of the day are worked out for your place.
The Agri-Cast slide shows -- (and NO DATA) when a number is not there, instead of making one up; the soil temperature, for example, is never estimated from the air temperature.
15. Voice and the teleprompter
A voice that reads slides and new alerts aloud, and a teleprompter for the person on air. Both are folds at the foot of the Show page: click one to open it.
15.1 The Voice page: read slides and alerts aloud
Voice is a fold at the foot of the Show page: pick a voice, write how the reading begins and ends, and choose what is read aloud. A voice can read the slides of a show as they play, and read each new alert. It plays on the Output, through the sound device chosen on the Sounds page. It is off until you switch on Read aloud on air, and it never reads alerts that were already in effect when AtmoDeck started.
Pick a voice
The Voice list holds the natural voices you have added, the cloud voices if you use them, and the voices of this computer. Hear it says your opening and a sample sentence; Stop stops it. More voice settings has the speed, the volume, the language (follow the Output, English, Spanish or French) and a filter to show only women or only men.
Add a natural voice, free
Under the list, Add a natural voice offers eleven voices that sound like a person: Amy, Lessac and Kristin (US women), Ryan and Joe (US men), Alba (a British woman), a Northern English man, Claude (a Mexican Spanish man), Davefx (a Spanish man), Siwis (a French woman) and Tom (a French man). They come from the free Piper program. Nothing is downloaded until you pick Add: then AtmoDeck downloads the program (about 22 MB, once) and that voice (about 60 to 120 MB) into its own folder. After that the voice works with no internet and sends nothing anywhere. Remove takes a voice away again. Natural voices are added on Windows. If a natural voice cannot speak, a voice of the computer reads the same words, so an alert is never silent.
Opening and closing
The Opening begins the Teleprompter’s script and the Closing after the last. Leave a box empty for the standard words. {greeting} becomes Good morning, Good afternoon or Good evening, and {station} becomes your station name. Hear plays each one.
More detail: Slides, Alerts, Cloud voices, if you want them
Slides
Read the slides aloud when a show puts them up is the switch; a step of the show can say otherwise.
How it sounds is Normal and friendly or Urgent.
Which slides: Current conditions, Today & tonight, the 3-day, 7-day and weekend forecasts, the Day planner (the next hours and the other cities) and Live advisories. A slide with nothing to say (a map, a camera, a list) stays quiet.
It reads the weather of your first city. The words of a slide are cut to fit the time the slide is on the screen, and each slide's words take the place of the last slide's.
Alerts
Read new alerts aloud reads each new alert in plain words, the same words as the social post for it: Heads up: a Tornado Warning is in effect for Jasper and Newton, Missouri until 3:45 PM. Take shelter now. in the friendly tone, or Tornado Warning for Jasper and Newton, Missouri until 3:45 PM… in the urgent tone, without the pictures, hashtags and links. Which alerts picks the kinds: tornado, severe thunderstorm, flood, special marine, watches, and everything else. A tornado, severe thunderstorm or flash flood warning stops whatever is being read and goes first, and a slide never cuts a warning off. Hear a sample alert plays one. Alerts in Spanish and French use the program's own sentence, since the social posts are written in English.
Cloud voices, if you want them
Folded away at the bottom, Cloud voices that need a paid key takes your own Azure Speech key or OpenAI key. The words of what is read are sent to that service to be spoken, and nothing else; the key stays on this computer, encrypted by Windows. If the service cannot be reached, a voice of this computer speaks instead. The page counts the characters used this month, as a guide for the bill.
The Voice reads what is on the slide on the air: every day of a 7-day, each column of the Day Planner, and every card of other slides, after a natural opening line such as “Rainy today, but warmer temperatures later this week.” Times are said as a person says them (“11 AM”, “noon”), and intro slides read their own text. In a show, a step stays up until the Voice has finished, for up to two minutes. The list of free natural voices to add has grown to twenty.
15.2 The Teleprompter
The Teleprompter, a fold at the foot of the Show page, is a script for the person on air to read from, on a screen of big scrolling words. AtmoDeck writes it from the live warnings and weather, and you add your own lines.
The script
The script is a list of blocks: Open, Warnings, Right now, The next hours, The days ahead, Other cities and Close. Open and Close are the words you wrote on the Voice page. The others are written by AtmoDeck and change by themselves when the weather or the warnings do, so they cannot be edited; that way they are always true. Language chooses English, Spanish or French, Style chooses sentences to read out or talking points, and Days ahead says how many days the forecast block covers.
Your own lines
Write a line in Add a line of your own (a sponsor read, a reminder, a name to say) and press Add line or Enter. Each line is a card of its own that you can edit, switch off with its tick, or take out. Move any card, a line of yours or a block, to where you want it in the script with its arrows, or by dragging its handle. The order is kept. Copy the script copies the whole thing as text.
Showing it
Show it chooses where: over this window, or in a pop-out window. A pop-out window is a window of its own that can sit on another screen; choose the screen, and tick full screen there to fill it. The same prompter shows in all of them. Space plays and pauses, the up and down arrows change the speed, the left and right arrows step back and forward, Home goes to the start, and Escape closes it. Size, Speed and Mirror (for a glass in front of the camera) are on the page.
The Show page has a green Start teleprompter button at the top that starts it the way this page is set. On a tablet, turn on the remote in Automation, open its Presenter page and tap Open the prompter.
16. Automation, remote control and keys
The Automation page holds the things that run by themselves. Everything on it is off until you turn it on. Storm-chasing has its own chapter (chapter 17) and the things that post alerts have another (chapter 12).
16.1 Remote control: your phone and a Stream Deck
Turn on Remote control to run the on-air controls from your phone's browser: switch layouts, hide alerts, toggle the map, force day or night, or reset everything. Open the link shown (or scan its code) on a phone on the same Wi-Fi. The link contains a secret token, so treat it like a password; New token replaces it if it leaks. Windows may ask to allow AtmoDeck through the firewall the first time (choose Private networks). Untick Allow other devices on my network to limit it to this PC.
Storm-chaser mode, and using the remote when you are away from home, have their own section: Storm-chaser mode.
16.2 OBS scene switching
AtmoDeck can switch OBS Studio to a scene when the severe theme starts and back when it clears. In OBS turn on Tools > WebSocket Server Settings > Enable WebSocket server (port 4455 by default; a password is optional). In AtmoDeck enter the host (normally 127.0.0.1), port and password, click Test connection & load scenes, then type or pick a scene for severe weather and one for the rest of the time. Capture the Output window in OBS with a Window Capture source and make one scene per look.
16.3 Chat weather requests (Twitch)
Enter your Twitch channel and a command (default !weather). When a viewer types the command and a place, such as !weather Springfield, MO, their current conditions and 3-day forecast appear in the Chat Weather Request widget for a few seconds. AtmoDeck only reads chat and never posts, needs no Twitch login, limits each viewer with a cooldown, and can be restricted to moderators. Turn the widget on in Layout & Widgets and position it in Edit Mode. YouTube chat is not supported yet.
16.4 Scheduled actions
Add actions that run at a time on chosen days using the PC's clock: switch to a saved layout (shows by the clock are on the Show page’s schedule). AtmoDeck must be running at that time.
16.5 Keybinds
The Keybinds page (Setup group) has two kinds of keys. Press Change beside one, then press the keys you want; Esc cancels. The page tells you when Windows or another program already uses a key, and one key never does two things.
Two keys that work anywhere, even while OBS has the focus. Take a screenshot of the Output as it airs (Ctrl + PrintScreen to begin with), saved in Pictures\AtmoDeck or copied, as Map Studio > Export says (section 18.17). Fit the Output to the screen (F12) makes a 1920 by 1080 Output exactly 1:1 on a 1920 by 1080 screen with no border (it covers the taskbar); press it again to go back.
Keys that run Map Studio and the Console, 47 of them. They work inside the Console window and are ignored while you are typing in a box. They come in groups: Playback (play or pause, step back and forward, first and newest picture, slower and faster, repeat), Camera (tilt, turn, zoom, tilt or lay flat, north up), Views (my area, United States, Canada, next and previous saved viewpoint, the tour), Scenes (open the next or previous scene, cut the Output to it, put it back), Tools (select, markers, measure, pen, text, eraser, click readings, clear), Layers and panels (radar, warnings, satellite, markers, header, 3D, the settings panel, find a Map Studio setting) and Console pages (Ctrl + 1, 2 and 3 for On Air, Map Studio and Slides). A plain key is fine for these.
17. Storm-chaser mode
Storm-chaser mode makes the Radar widget follow your phone. You open a page on your phone, tap one button, and the radar on your broadcast re-centers on wherever you are, with a pulsing YOU marker and the tornado and severe thunderstorm warnings around you.
17.1 What it changes (and what it does not)
The Radar widget only. It centers on you, shows the area within your chaser radius (15 to 100 miles), draws the YOU marker, and shows tornado and severe thunderstorm warning boxes for wherever you are, even outside your saved counties.
A breadcrumb trail (light blue line) shows where you have driven since you started chasing. Right-click the Radar in Edit Mode to switch it off. It is cleared when you stop chasing.
Storm motion arrows are drawn on each warning box, pointing the way the storm is moving with its speed in mph (about 30 minutes of travel). They use the motion in the warning text; a warning with no motion in its text has no arrow. Right-click the Radar to turn them off (they also appear on the normal radar).
Warning notice and colored border. When your position is inside a tornado warning or a severe thunderstorm warning, a notice appears on the Radar ("YOU ARE IN A TORNADO WARNING", the end time and the storm motion) and the border of the map turns the color of that alert type. The colors are the ones set in Look > Alert Colors, so a tornado emergency, PDS, observed and plain tornado warning each have their own, and so do the severe thunderstorm levels. Right-click the Radar to turn the notice and border off.
Across the border: the Radar and the warnings follow the country your phone is in (see section 6.2).
Everything else stays put unless you tick use my GPS town for everything (below). Otherwise alerts, the threat matrix, storm reports, the forecast towns and every other widget keep using your normal area.
The Radar widget has to be turned on (Layout & Widgets) for you to see any of this. The Storm Chaser starter layout is a good place to begin (section 8.7).
Nothing is saved. Stop chasing (or restarting AtmoDeck) puts the radar back on your normal area.
17.2 Optional: use my GPS town for everything
In Automation > Remote control, tick Storm chaser: use my GPS town for everything. While you are chasing, the Current Conditions strip and the Hourly bar show only the town you are in (no rotation between towns), and alerts, the severe theme, the threat matrix, the alert map and the Discord alerts use the counties around you: your county plus its neighbors within the chaser radius. When you tap Stop chasing, or untick the box, your saved area comes back. It is off by default, so with it off only the Radar follows you.
17.3 The phone page while chasing
While you are following your location, the remote page on your phone shows a warning box at the top. If you are inside a warning, it is a large box in that alert's color ("YOU ARE IN A TORNADO WARNING", the end time and the storm motion) and the phone vibrates once. If you are not, it shows the nearest tornado or severe thunderstorm warning with its distance and direction (for example "15 mi ESE"), its motion and end time, or says there are none within 200 miles. It refreshes every few seconds. Distance is to the nearest edge of the warning box.
17.4 Before you start: turn on the remote
On the PC running AtmoDeck, open Automation > Remote control and turn it on.
Leave Allow other devices on my network ticked. If it is off, only the PC itself can open the page.
Tick Secure link (needed for phone GPS). Phones only share their GPS location with a secure (https) page.
Optionally set the Chaser radius (15 to 100 miles): how far around you the radar looks.
The card shows a link and a QR code. Scan it with your phone, or send yourself the link. Treat the link like a password: it contains a secret token. New token replaces it if it leaks.
17.5 Chasing from your phone
Open the link on your phone. For GPS use the secure (https) link, on the port just above the normal one (for example https://192.168.1.20:8766/?t=… when the normal port is 8765).
The first time, the browser warns that the connection is not private. That is expected: it is your own PC, using a certificate AtmoDeck made for itself. Choose Advanced and continue. You only do this once per phone.
In the Storm chaser card, tap Follow my location and allow location when the phone asks. The card turns green and shows the town you are near, and the radar on your broadcast moves to you.
No GPS, or want to look somewhere else? Tap Jump to a place and type a city. The radar re-centers there instead.
When you are done, tap Stop chasing.
Privacy. Your location goes from your phone to your own PC, and nowhere else. It is never sent to AtmoDeck's servers and is not saved.
Keep the phone page open while you chase: it sends your position about every 20 seconds while Follow my location is on. Phone GPS depends on your browser, signal and battery settings, so if the location stops updating, tap Follow my location again. Jump to a place always works.
17.6 Where the phone can reach the PC
The remote page is served by your PC to devices that can reach it over a network. It is not relayed through AtmoDeck's servers, so the phone and the PC must be on the same network or a network you connect them with. There are three common setups:
Setup
Works?
What to do
Phone and PC on the same Wi-Fi
Yes
Nothing extra. Use the link AtmoDeck shows.
PC in your vehicle (a laptop), phone connected to it or to the same phone hotspot
Yes
The usual chasing setup. Turn on the phone's hotspot, connect the laptop to it, and use the link AtmoDeck shows (its address will be the laptop's address on the hotspot).
PC at home, phone on cell data or another Wi-Fi
Only with a private network
Use Tailscale, described next.
17.7 Tailscale: reaching your home PC from anywhere
Tailscale is a free tool that puts your PC and your phone on a private network of their own, so they can talk to each other from anywhere, as if they were on the same Wi-Fi. Nothing is opened to the public internet. It is not part of AtmoDeck and is not supported by us, but it has been tested with the remote page and works. Tailscale has a free plan for personal use (check their site for the current limits).
What you need: the AtmoDeck PC stays on, awake and connected to the internet, with AtmoDeck running. Tailscale must be running on both devices.
Make a Tailscale account. Go to tailscale.com and sign up with a Google, Microsoft, Apple or GitHub login. Remember which one you used: you must use the same one on both devices.
Install it on the PC. Download Tailscale for Windows from tailscale.com/download, install it and sign in. Its icon appears near the clock.
Install it on your phone. Get the free Tailscale app from the App Store or Google Play, open it and sign in with the same account. Turn the switch on. It may ask permission to add a VPN: allow it. That is how it works.
Find your PC's Tailscale address. In the Tailscale app on your phone, your devices are listed. Your PC shows an address that looks like 100.64.12.34 (and a machine name). Tap it to see or copy it. You can also click the Tailscale icon on the PC and choose your PC from My devices.
Set up AtmoDeck. In Automation > Remote control, turn the remote on, and make sure Allow other devices on my network and Secure link are ticked (see above). Note the port number (8765 by default; the secure link uses the next one, 8766).
Build the link for your phone. Take the link AtmoDeck shows and replace the address part with your PC's Tailscale address. For example, if AtmoDeck shows http://192.168.1.20:8765/?t=abc123 and your Tailscale address is 100.64.12.34, the secure link on your phone is https://100.64.12.34:8766/?t=abc123. Keep your own token (?t=…) and note the https and the port one higher. Send it to yourself and open it on the phone.
Accept the one-time warning (see above), tap Follow my location and allow location. You are chasing from wherever you are.
Save it. Add the link to your phone's home screen or bookmarks so it is one tap next time. The address stays the same as long as the PC stays in your Tailscale account.
Tip. Try it once at home first: turn your phone's Wi-Fi off, leave Tailscale on, and open the link on cell data. If it works there, it will work on the road.
17.8 If it does not load
Check that Tailscale shows Connected on both devices and the PC appears in your phone's device list.
Check that AtmoDeck is running and Remote control is on, with Allow other devices on my network ticked. Restart AtmoDeck after changing it.
Check that the PC is awake (not asleep) and that Windows is not blocking AtmoDeck in its firewall. If Windows asked, allow AtmoDeck on private networks, and if the page still does not open over Tailscale, also allow it on public networks.
Check the link: https, the Tailscale address (starting with 100.), the secure port (normal port plus one) and your token. A wrong token shows an error, and many wrong tries lock the page for a minute.
If you use the plain http link, everything works except GPS. Use the https link for GPS, or Jump to a place.
Do not open a port on your router to reach the remote from the internet instead. It exposes a control page to everyone, and the token would be its only protection. Tailscale gives you the same reach without that risk.
Part 4Map Studio
The radar map studio: live radar, satellite, models, storm tools, and an archive of past storms.
18. Map Studio: the basics
Map Studio draws a map behind your widgets on the Output window and is run from the Map Studio page of the Console. It can show a single NEXRAD radar or the national radar, a satellite loop, outlooks, warnings and a hurricane's track, on a map you style yourself. The map uses free public data and needs no keys (see the API guide).
18.1 Turning it on
Open Map Studio in the Console. The On output switch at the top left of the toolbar puts the map on the Output; while it is on, it takes the place of the slide background and the header of the broadcast.
It opens the way you left it. Map Studio remembers everything you have on: the product you were on, the layers, the data layers, the rotation markers, the readings, the weather icons and all their settings are all still there the next time AtmoDeck starts (a new install opens on the national radar and the warnings). Only the camera (centered on your area, flat) and the 3D volume start fresh.
The Console preview is drawn at the Output's own size and shown smaller, so the city names, the line widths, the zoom and the switch between the flat map and the globe are the same in both, whatever size the Console window is.
The national radar draws on your graphics card with WebGL 2. If a PC does not have it, the Console shows a message in place of the national radar.
Every map starts paused, standing on its newest picture; press play to run the loop.
18.2 The top bar, the tool rail and Active layers
Map Studio is laid out the same way in every mode: a top bar of menus, a tool rail down the left of the map, the play bar under it, and Active layers at the side.
Where
What is in it
Live Map / Forecast Builder / Archive
The three modes of the page. Live Map is the weather of now and the forecast; Forecast Builder (fronts, highs and lows, paint; full version) has its own set of tools; Archive plays a radar of the past (chapter 25).
Undo, Redo and the clock
Undo and redo the changes made to the map's settings; the clock lists them and goes back to just before any of them.
Where what you change goes: on air as you change it, into the next map to take to air (section 18.5), or nowhere but this preview (section 18.6).
★ Favorites
Opens the product library on the products you starred (section 18.3).
Active layers
Shows or hides the panel of everything on the map (below).
Map appearance
The Map font switch (section 23.5), Base map and labels (section 23.2), Header and output appearance (section 23.10), Legends, Fonts and text, Color tables (section 19.6) and Views and camera (quick views, rotate and tilt, viewpoints, the tour and the slow turn).
Library
What you saved, by type: workspaces, layer sets, map views, weather setups, map playlists and show blocks (section 18.7).
Export
Clip for social, screenshots, the clean screenshot, a recording, and an export of the loop as MP4 or GIF (section 18.17).
2, 3 and 4 panels
Split the map into panels that can move and play together (section 23.15).
Watched places (the pin)
The places you answer for, told when a warning or a storm concerns them (section 18.9).
The place box
Find a city, a radar site or coordinates and fly there.
QUICK
Up to 16 favorite products or layer sets, one click each (the first twelve also on the keys 1 to 9, 0, - and =). Use the + button to add the product on screen, and Edit to change the icon, name, product or group.
Tool rail: MAP
The Base map button: the style of the map under everything, with its labels, roads, borders, terrain, globe, sky and night.
Tool rail: DRAW
Select, markers, the pen and the other drawing tools, storm tracks (a cell or a line), the eraser, undo and clear, and the button that shows every radar site (section 19.2).
Tool rail: RADAR
The Rotation button (rotation markers on or off) and, with one radar on the map, 3D and the scope (each with its menu), the cross section and the 3D box. On the national radar, 3D stands the whole mosaic up round the middle of the map.
Tool rail: READ
My counties, point readings above the cities, the Smooth button for model maps, weather icons, Clear all (every box, sounding, forecast slide and marker card off the map, here and on the Output), click readings, Soundings (with the box sounding in its dropdown, section 19.14) and measuring.
More detail
Active layers is one list with a search box (Find a Map Studio setting). + Add product and + Add custom layer are at its top. Every layer on the map is a row, and opening a row shows every setting it has: its color table, floor, smoothing, lines and readings. The warnings, the storm tracks, the markers, and the header and legend are rows too. section 23.8 describes the list and its order. At its foot a loading box shows, while something loads, the progress of each product (the radar loop, the satellite, Insight) with Stop and Restart; Restart starts it again on the Output too. The panel can be docked at the side or along the bottom.
A product's own options (its menu, and for one radar the scan and the tilt) appear in the top bar while that product is on, and every layer's settings are in its row of Active layers. Layers that are not pictures of one product (lightning, the storms of Insight, tropical cyclones, earthquakes, wildfires and the rest) are map overlays: they are added from + Add product and then have a row of their own (section 18.3).
The tool rail is icons only. Point at a tool and its name comes at once beside it. A tool with a list (markers, the pen, storm tracks, 3D, the scope) has a small arrow on the corner of its button: click the arrow for the list.
A tool of the rail that can be on or off is lit exactly when its thing is on the map, in the live map, in Archive and in the forecast builder, and a click on it again takes it off. This holds for the cross section (lit while a section is on the map), the click readings, 3D, the scope, the point readings and the rest.
Quick buttons keep their kind when saved: a model or mesoanalysis product comes back as that product. A button can also be set to add its product over the map as a layer; a click again takes it off.
Text and pictures you add with the Draw tools lie over the city names, so a note put on a city can always be read.
Under the ocean. The layer list always has an Under the ocean group. Drag a layer onto its heading, or onto the lower half of the ocean layer, to draw it under the sea, just over the base map; the down arrow of the lowest layer above does the same. Drop on the upper half of the ocean layer to put it back over the sea.
18.3 Adding products: Add product, Favorites and Find a place
+ Add product, at the top of Active layers, opens the library of everything Map Studio can draw.
Categories down the side: All products, Favorites, Recently used, then Radar & Satellite, Alerts & Outlooks, Storms & Tropical, Conditions & Observations, Forecast Models, Forecast Products, Current Mesoanalysis and Other Hazards. The search box finds a product by name in all of them, and every outlook is there (the Storm Prediction Center's days 1 to 8, excessive rainfall, fire weather, winter and heat risk).
Map overlays are in the same list, each marked Map overlay: Storms (Insight), Lightning, Warnings and watches, Storm tracks, Tropical cyclones, Hurricane model tracks, Aircraft recon, Storm surge and tide gauges, Roadway flood and hydroplaning risk, River gauges, CoCoRaHS rain reports, Local storm reports (NWS), Storm reports (SPC), the snow layers, Buoys, Ship reports, Sea surface temperature, Aurora forecast (OVATION), Wildfires and fire detections, Wildfire smoke, U.S. Drought Monitor, Earthquakes (USGS), Tornado outlook days 1 to 3, ProbSevere, Past tornado paths, the Ocean layer and Terrain. Add puts one on the map; one that is already on says On map and offers Settings.
Use main makes the product the main picture of the map; Add layer lays it over what is there, as a layer of its own with its own settings and legend.
The star on a product puts it in Favorites, which the ★ Favorites button of the top bar opens directly. What you used lately is under Recently used.
A weather model lists what its newest run really contains, so the list of a model fills in when it has been read.
+ Add custom layer, under it, is for your own data: a GeoJSON, KML, KMZ or shapefile, a placefile, or a link to one (section 23.9).
Find a place, at the top left of the map, takes a city, a radar ID or coordinates and flies the map there; Views beside it lists your quick views and viewpoints. Ctrl + K finds a product by name from anywhere in the Console (section 5.2).
A layer added over the map keeps its own timeline. A model added as a layer can set the pace of the loop by itself: choosing a Window that runs ahead follows that layer, and the main picture is left as it is.
18.4 A day of weather: highs and lows, peak wind, rain total and humidity
Some products show one day of weather, and the day is picked in the layer. They are in Add product > Conditions & Observations, in the list of current conditions:
High temperature and Low temperature: the warmest and the coolest the air gets on the day.
Peak wind and Peak wind gust: the strongest the wind (or its gust) blows on the day.
Precipitation total: the rain (and melted snow) of the day, added up.
Lowest humidity and Highest humidity: the driest and the dampest the air gets on the day.
Open the layer's settings and choose the Day: Yesterday, Today so far, Today (forecast) (for wind, gusts and rain it says Rest of today (forecast)), Tomorrow, and then each of the next five days by its weekday. Search for them by what they show, such as highs and lows, peak gust or daily rain.
Yesterday and today so far are measured. They come from the hourly analyses (RTMA) and are worked out over each place's own calendar day, so a place in Florida and a place in Oregon each get their own midnight to midnight.
Today (forecast) and the days after are the Weather Service's forecast (NDFD): its high or low, its lowest and highest humidity, the strongest of its wind or gust hours, and its rain totals added up. The forecast of rain goes about three days ahead; a day past that says the forecast does not have it yet. Late in the day, when the forecast has let go of today, Today (forecast) shows what was measured.
Today is the date where the map is, so just past local midnight it is already the new day. Until the first hours of the new day are in, Today so far says so instead of showing yesterday, and a place whose day has not begun yet is left blank. The header's time box names the day and date (TODAY • SUN, OCT 18). A point value always sits above its own name, and takes the place of the city under it.
18.5 Live or Explore: Send to output
Beside the map's modes is an Explore / Live switch. It reopens as you left it.
Live: what you do on the Console's map (moving and zooming, products and layers, the time and the loop, drawings) shows on the Output as it happens. ON AIR shows beside the switch and a red ring goes round the map. Going Live sends the map as it is on the Console to air at once. While a loop plays in Live, the Output keeps the time at its own even pace and the Console follows it, so the picture on the Console is the one on the air at that moment; after a hitch on the Console (a menu, a pan) it jumps back in step, and the air is not held up.
Explore: the map in the Console is a preview. Moving it, changing products and layers, and placing or following storm tracks change only the Console's map; the Output goes on showing what it showed, and the bar says Output unchanged.
In Explore:
Send to output lights once the radar, the satellite, the layers and the map of the preview have loaded. Press it and the Output changes in one step to the preview's map, its layers and its camera. A new preview starts from that map at once, so what you do next stays off the air until you send it too.
Reset throws the preview's changes away and goes back to the map last sent.
A preview you have not sent is kept when AtmoDeck closes, and comes back as you left it the next time. Saved maps, blocks, shows and events are saved as you make them, whether the map is sent or not.
Settings a teammate shares reach the preview too, without undoing the changes you have not sent.
A refresh works the same way by itself: the picture on air stays until the new one is ready. The on-air lights of Status & Health say which picture is on and how new the newest is, and a small chip by the play bar says whether the picture is whole and how old it is.
Output on / Output off. Beside Send to output is a button that says whether the map is on the Output. Output off takes the map off air altogether; pressing it again puts the last map sent back. In Live, ON AIR shows only while the output is on. Send to output, or switching to Live, turns it back on.
Export in Explore needs a map on the Output; when there is none it says so (The output’s map is off) instead of saving a blank picture.
18.6 Looking round without touching the Output
Switch the map to Explore (section 18.5) to look round it without touching the Output: the Console's map is then a preview until you press Send to output. In Live everything you do on the map is on air. A clean screenshot taken from the Console in Explore is a picture of the preview, not of the Output.
18.7 The Library: what you saved, by type
Library in the top bar is everything you saved in Map Studio, in one window with a tab for each kind and the number saved in each, instead of one mixed gallery:
Workspaces keep the whole map layout and its panels.
Layer sets change the products at the place you are looking at: the layers on the map and all their settings under a name, also for a quick button.
Map slides are the slides of the map: the map exactly as it is (where it looks, the radar, the layers, the look), to open again or to play as a slide (section 13.16).
Weather setups are ready-made starting points for a kind of day; five come with AtmoDeck.
Map cues and blocks open in their own editors (section 13.1).
Save the current map saves what is on the map in the tab that is open. Favorites only and the folder list (All folders) narrow a long list, and each saved item can be opened, updated from the map as it is now, put in a folder or deleted. Import / export workspaces saves a workspace as a file and brings one in from another computer, and Broadcast slides and playlists opens the map's Saved menu (map slides and map playlists).
Past events are not kept here: they are saved and opened again in Archive mode (section 25.7).
18.8 The names of what you save: map cues, show plans, blocks, map slides, layer sets
Each kind of thing you save has one name, used the same way in Map Studio's Saved menu, the Library, the Show page, share packs and the team's bucket:
Name
What it is
Map cues
One click (or a hotkey) sets up a whole segment: its layers, the viewpoint group, a map slide and a layout. Saved in Saved > Map cues; the Dashboard's Run of show card lists them in the order you air them.
Show plans
The run of show on the Show page: blocks and other steps in order, with their times.
Blocks
The map as a timed step of a show plan: a still for some seconds, or a loop. Saved in Saved > Blocks.
Map slides
The map exactly as it is (where it looks, the radar, the layers, the look) as a slide of the slideshow, also cut to by hotkey. Not a step of a show plan. Saved in Saved > Map slides.
Layer sets
Several map products turned on together, wherever the map is looking. Saved in Saved > Layer sets.
Alert color presets
The colors of the warnings and watches, and which ones are hidden, switched together on air. Saved in Look > Alert Colors, switched from On Air > Alert color presets.
Slides
The graphics of the slideshow, made in the Slide Builder.
Earlier versions called these Shows (now map cues), Show blocks, Map views or Saved maps (now map slides), Layer bundles or Layer groups (now layer sets), and Alert bundles (now alert color presets). Only the names changed: everything you saved is where it was.
18.9 Watched places
The pin button of the top bar opens Watched places: the places you answer for (a home, a school, a stadium). Type a Name for it and, under Where, a place name or a latitude and longitude, then press Watch this place.
A watched place is told when a warning covers it, when the warning is updated, when a warned storm is about to reach it (worked out from the storm's own motion) and when the warning ends.
It can also be told when a forecast number crosses a limit you set: wind gusts, rain or temperature over or under a value.
Each thing is told once, not again and again; you choose how long before the same thing may be told a second time.
The notices come in the bell at the top of the Console (section 5.3). Watched places are part of the map's settings, so they come back as you left them and are saved with a workspace (section 18.7).
18.10 The play bar and the loop
The top row has first, back, play, forward and newest, the timeline and its time. Below it: Window, how much time the loop covers (plain stretches: the past hour, 3 hours, 6 hours and up to a day, and ahead from the next 3 hours through Next 36 hours, Next 3 days, 5, 7, 10 and 16 days, for the models that reach that far: the GFS and GEFS 10 days, the NBM 8, the ECMWF IFS and AIFS 15, NOAA's AIGFS 16; a model that stops sooner shows what it has); Speed (Slow, Normal or Fast); and, beside it, Smooth, Repeat, Each frame (frame by frame, through time, or a set 0.25 to 3 seconds on every frame: section 18.11), End pause (how long the newest picture stays before the loop starts again) and Header. The loop has every picture there is: the national radar every 2 minutes and one radar every scan (the Fine national detail skips some on long loops, for the graphics memory). Smooth glides from one picture to the next and follows the movement of the echo, so a storm advances rather than ghosting; untick it to step. Smooth works on one radar’s own scans too (Level 2 reflectivity with its smoothing off): the loop blends from scan to scan and each picture stays as sharp as it is. On the Output the loop plays at an even pace of its own, only a touch slower or faster to stay with the Console, so a busy Console (a menu, a pan, a layer being made) does not make the loop on the air stop and start.
Pace set by. Under the bar, any layer with pictures in time (the main picture, the satellite, each data layer you add, a storm's track) can set the pace with one click; the others show what they have nearest that time.
The strip under the slider is placed by time, on the same line as the slider's steps, and ends where the pictures end instead of always filling the bar. With the radar's pictures in the past and a model reaching ahead, the marks sit in the past part of the bar and the white mark is under the thumb.
Storm track lane. With Animate the forecast on for a tropical storm, the bar gets a lane of its own: a step every 3 hours from now to the end of the storm's forecast. It needs no model. The header shows the time the storm is at, the same clock as the play bar.
The Loop and Header boxes show or hide the loop and the header on the Output. Frames load newest first, so the loop plays whatever has arrived.
18.11 The pace of a loop, the echo between scans and the running clock
Each frame, on the play bar, sets how a loop is paced:
By speed (frame by frame), the way a loop starts: every picture gets the same time, set by Speed, however far apart the pictures are. A radar's scans are not evenly spaced (a second sweep of the lowest angle comes a minute after the first, the next volume six to ten minutes later), so this is the even one.
By speed (through time): the loop moves through time at a steady rate (an hour of loop in about 12 seconds at Normal), so pictures close together pass quickly and a long gap takes longer. Use it when the radar and the satellite play together and should pass at the same rate.
0.25 to 3 seconds: a set time on every picture, for forecast models and other slow products.
Smooth carries the echo along between two scans of one radar: when the whole picture moved one way (a line of storms, a band of rain), it is moved that way while the loop glides, so a storm advances instead of fading out in one place and in at another. Where parts of the picture moved different ways, or stood still, the loop fades in place there instead, so nothing is dragged along that did not move. The national radar's pictures are two minutes apart and fade in place.
More detail
The header's clock runs with the loop. While a loop plays, the time in the header passes minute by minute from one picture's time to the next one's, in every kind of loop (one radar, the national radar, the satellite, a data layer, a storm's track), with Smooth on or off. Paused, it is the time of the picture on show.
Lightning keeps time with the loop. While a loop plays, the lightning layer shows the flashes up to the moment the loop is at, minute by minute, so they stay in the storm as the echo is carried along; the newest picture of a playing loop gets the flashes of its own time, not of this moment. Paused on the newest picture, the lightning is live. A flash dims steadily as it ages, so the newest ones stand out from the trail behind them.
One radar's loop has each scan once. The scan the real-time feed delivers and the same scan from the archive are one picture, and the two sweeps a radar makes of its lowest angle, one straight after the other, are one picture too. A real rescan of the lowest angle later in the volume (SAILS, MRLE) is still a picture of its own.
The Output keeps to the Console's picture. The Output plays the loop the Console plays: it shows the two pictures the Console is between and does not go on by itself while the Console is telling it where the loop is. If the Console is busy for most of a second, the Output plays on from where it is.
A radar product with its smoothing at 0 is never blended. The loop steps from one picture to the next with no fade and no glide, on the preview and the Output, so the cells are seen exactly as the radar measured them. The Smooth box on the play bar is greyed out while it is so; turn the product's smoothing up (or Smooth every map) to blend again.
18.12 Drawing and reading
Telestration: pen, highlighter, line, arrow, circle, box, text and eraser, with undo, clear, colors, sizes and a fade-out timer. Drawings are anchored to the map, so they stay put as it moves. Drawings last until cleared or faded.
Map text: text can have a shine (a gradient of its color with a gloss across it) and a shadow (a soft drop shadow with a little depth), in your broadcast font. Shift+Enter starts a second or third line. Drag a text with the Select tool to move it, and scroll over it (or use the Size slider in the Text menu) to resize it. Save a text to the text gallery in the Draw menu and place it again any time with two clicks. Text stays upright and readable when the map is tilted in 3D.
Weather icons: the same animated icons as the forecast slides, above the cities: the weather there now, or on a forecast frame, the forecast for that frame's hour, so they change as the forecast plays. With the city readings on, the icon sits beside the value.
Readings: city readings above the names, Click readings (right-click clears), and Measure (drag a circle; the radius shows). Readings can read any national, RTMA or NDFD product, whatever the radar is drawing.
Scope: a circle that follows the mouse over the preview and swaps in another product of the same scan (velocity by default). Alt + scroll changes its size. Hold Ctrl (or Shift) and the left mouse button to show it just while held, even when it is off; let go and it goes away. Pin in the Scope menu (or O with the mouse on the spot) leaves the scope where it is when the mouse moves off the map, so a screenshot from the Export menu keeps it and the Output shows it; unpin it the same way, or switch the scope off.
Cross section: drag a line and a panel shows the volume along it for any product. Drag the panel to move it and scroll to size it. The Section menu beside the tool shows it in its window, standing on the map along its line, or both; its look (raw blocks, soft, or smooth between the voxels), detail, top, height stretch and background. Drag an end of the line, or the line itself, and the section is read live as it moves.
Viewpoints: in the View menu, Save this view keeps the whole camera (place, zoom, turn, tilt). The tour flies from each to the next and back round to the first: Glide keeps moving at an even pace, Stops eases into each and waits, with the time between views, the pause, a straight or arcing path and looping. It runs on the preview and the Output together; touching the map ends it.
Click readings (the Readings button on the tool rail) has an arrow beside it with how the readings look: the font, weight, size (a percent or exact points), color, outline, box and unit, the look the point readings share, and a Clear button. The button is lit while readings are on the map; a click on it then clears them. Sizes in points are now honoured everywhere they are set: point readings, the city names the readings keep clear of, the names in 3D, the county names, the radar sites' names and the box padding behind names.
18.13 The right-click menu, soundings and forecast slides
Right-click the map in Map Studio for a menu about that spot:
The nearest NEXRAD radar, to switch to it.
A sounding: the Storm Prediction Center's analysis for that exact spot, or the nearest observed radiosonde launch. It is worked out with SHARPpy's own routines, ported to the app and checked against SHARPpy's output on 47 real soundings: surface, forecast, mixed-layer and most-unstable parcels, CAPE and CIN, the effective inflow layer, storm motion, helicity, every severe, winter and fire index, the precipitation type, the possible hazard type and the SARS analogue soundings.
A mesoanalysis map (section 21.7) placed on the map.
A current conditions, hourly or 5-day forecast slide for that spot.
Slides and soundings appear in the Popup Box, a widget you place and size in Edit Mode (Layout & Widgets) and that shows only while one is up. The forecast slides are the ones a show plays: its header and logo, its city line and background, its cards, animated as they are in a show, in the font you picked for the whole broadcast, and with your own weather icons if you uploaded them (section 7.5). They fade away when you press Esc.
The sounding is drawn the way SHARPpy draws it: the skew-T with the parcel traces, effective layer, heights and wind barbs, the wind speed profile, the hodograph with the storm motions and Corfidi vectors, the thermodynamic and kinematic tables, and three insets to choose (storm-relative winds, storm slinky, theta-E, temperature advection, STP, SHIP, winter weather, fire weather, SARS analogues). A bar under the card chooses the parcel, the right or left mover and the three insets (your choices are remembered), and closes it. It shows on the Output too.
Air trajectories. Right-click a spot and pick Air trajectories: the paths of the air at 850, 700 and 500 mb over the next 48 hours, or where it came from over the past 48, worked out from the GFS wind, with a dot every 6 hours. The paths stay on the map, and on the Output, until Take the air trajectories off in the same menu.
18.14 Warning boxes
A click on a warning brings up its box, and Ctrl-click adds a box beside the ones already showing (section 18.16). With Show a clicked warning in the header on (the header’s settings), a click chooses the warning instead (it glows, its name takes the header over, and it goes on the threat matrix and alert strip) and Ctrl-click sticks a box to it. The box has its name in its color, when it ends, where, the hail and wind tags and the people it covers (the people living in the named places inside it, from the Census list of named places, so people who live outside any town are not counted; the count in section 22.6 is made from every block group of the 2020 Census and is more complete), and the hospitals and schools inside it, counted by name from OpenStreetMap (they say "at least", since the map is not complete; a watch too wide to count says so). Put as many on the map as you like, drag each where it reads best, close them one at a time or with Clear all; they are on the Output too. The Warnings and watches row of Active layers can turn them off.
18.15 Warning fills: under the radar or over it
A warning is drawn as its outline and its fill. The outline is always over the radar, so the edge of a warning shows through any storm. Draw the fill over the radar (in the Warnings card, under the global style of every warning) decides where the fill goes:
Off (as it starts): the fill is under the lowest radar or satellite picture, so the storm inside the warning is seen in its own colors with the warning's color around it.
On: the fill is laid over the radar, tinting it.
18.16 Story boxes: what a click on the map brings up
Whatever you click on the map comes up first as a story box: a broadcast graphic, the same on the preview and on the Output. It says who the information is from, what was clicked, the one line that matters in its color, the numbers large, a few facts, its chart when it has one, and a line from the box to the spot on the map.
River gauges: the crest or the stage now, the flood stages, a flood alert over the gauge and the hydrograph (section 22.8).
Rotation markers: what it is and how strong, the rotation, the tornado chance and the AtmoSpin value large, the signs the radar shows (debris, hook echo, dual-pol), and the tornado intensity guidance as a panel of its own: measuring, then the rating with the chance of each EF class (section 20.6).
Hurricane hunters: the aircraft and its storm, its last report large, and the mission's extremes with their times (section 22.11); center fixes and dropsondes too.
Storm reports: the kind of report with its icon, where and when, and what was reported.
Earthquakes, wildfires, buoys, ships and stations, snow reports and SNOTEL, CoCoRaHS, ProbSevere storms, past tornado tracks, road flood risk and the places of your custom layers: each has its story, made from its card.
More detail
The card with every detail is still there. On the preview the story has two buttons: Raw data shows that card (in the preview only: the Output keeps the story), and × closes it. Back to the story on the card returns. The box can be dragged; the Output puts it in the same place, and moves it clear of your layout's widgets when it would come up under one.
Story box size (Base map panel > Mouse and cards, section 23.2) sets how large the story boxes are, here and on the Output; Raw data card size beside it is for the card.
A click on a warning brings up the warning's box on the map, where you clicked, and it is a story box too: the office that issued it, the warning's name, when it expires in the warning's color, the affected areas and its tags, and large the people inside it, the hospitals and the schools (each says it is being counted until its number arrives), with the largest towns and the hospitals by name under them. Below that is what the warning itself says, part by part and in the Weather Service's own words: the hazard, the source, the impact, where and when, the places in its path, where the storm is moving and what to do. A watch, an advisory or a river flood warning has its text read when its box opens. Details: Compact keeps each part to a line or two; Full gives it whole.
Several boxes at once. A plain click shows what was clicked alone. Ctrl-click (or a quick Shift-click) adds: what is showing stays and the new box opens beside it, whatever kind it is. So a river gauge can stay up beside its flood warning, or three warnings beside each other, with one key held. The boxes step aside from one another instead of lying on top, and each has its own line to its spot. A box kept this way shows what it read when it was kept.
Compact or detailed. Double-click a box, or press its Less / More button, to switch it between its short form (the name, the time, the numbers) and its full one. The B key does every box on the map at once (it can be changed in Keyboard shortcuts), and the next box opens the way the last was left. Several detailed boxes are large; compact ones fit side by side.
Time zone (the header's settings): the clocks of the map follow the time zone of the area on screen. Turn Follow the map off and choose a zone, and the header, the play bar and the warning boxes stay in that zone wherever the map looks.
18.17 Screenshots and videos (Export)
Export holds both. For a video, choose what to record (the whole output with its overlay: the header, legend, ticker and widgets, or the map only) and its length, and press Record; it is saved as an MP4 in Pictures\AtmoDeck, in real time. To make a smooth MP4 or animated GIF of the loop instead, choose An export of the loop: pick where on the timeline it starts and stops, how fast it plays, how many times, and how long the last picture is held each time round. The pictures are taken one at a time, so it does not depend on how fast the computer is. For a still, the Take a screenshot button, or Ctrl + PrintScreen (which works even while OBS has focus), saves a picture of the radar map alone on the Output to Pictures\AtmoDeck and copies it to the clipboard. F12 (a key you can change in Keybinds, section 16.5) fits the Output to the whole screen it is on, keeping the 16:9 or 9:16 shape.
Map Studio > Export has a Clean screenshot: only the radar map and what you tick (the header, the legend, the storm arrival times, pop-up boxes), with a Powered by AtmoDeck box at the bottom right. Every other widget is hidden for the moment the picture is taken. Shape makes it as the output, square, 4:5 or 9:16: the middle of the picture is taken, and the header and the boxes you ticked are brought inside it. Make Ctrl+PrintScreen take the clean one changes what the key does; Whole output is still the picture as it airs.
More detail
On the Standard and Pro plans, a badge you switched off (section 8.3) is left out of every screenshot and video too.
To the show. At the foot of Export, To the show sends the map to a show as it is now. Pick the show, then As a slide (the picture held 5 to 60 seconds) or As an animation (the loop played 1 to 5 times round). It is kept as a block named after the header's title, so Save block lists it, and it is added as the last step of the show you chose.
Clip of the card appears in the Export menu while an explainer card is open (section 19.16). It plays the card (or the whole Storm day) from the start and records it as an MP4: Upright (1080 x 1920), Square (1080 x 1080) or Wide (1920 x 1080), chosen under Card shape. The upright and square clips add the card’s question and the place above it, the upright one the answer below it, and each has the Powered by AtmoDeck badge unless you switched it off. The clip is saved in Pictures\AtmoDeck and Social Posting opens with it attached. Closing or changing the card stops the recording.
18.18 The sky, and a map that follows the newest picture
Fresher radar. A scan from the real-time feed is drawn from the latest finished sweep of the lowest tilt (radars rescan it two or three times in a volume, about every two minutes instead of every six and a half), and every new sweep is fetched as soon as it is there. Live sweep (the Scan line button, section 19.5) draws the radials of a new scan as they come in, over the picture before. The map keeps pulling scans while it is out of sight, so coming back to it has the last several minutes already on it.
The sky. Tilt the map until the horizon is on screen (it tilts to 85 degrees) and the sky above it is drawn for the time of day, with the real stars at night, clouds drifting by day, and the sun and moon where they really are, the moon in its true phase (the Sky and space group of the globe settings). Close in, from zoom 9, the streets and built-up ground are lit from the map itself over the night shading, so the city lights stay sharp.
The map follows the newest picture. Sitting on the latest frame, a new radar or national map picture takes you to it, while a frame you went back to stays where you left it.
The Console's top menus open over the drawing tools, and panning and zooming stay smooth: the night shading, the city lights and the storm-motion measuring run in the background.
18.19 The radar-late mark on the Output
Radar delayed. While the newest radar picture (or national map) is older than it should be, the Output map carries a small red tag at its bottom left: Radar delayed with the age of the picture. It goes when a fresh picture arrives. A stored archive on air and a forecast loop are old on purpose and are not marked. Turn it off in Map Studio settings > The map > Mark the map on air when its radar is late; the Console's lights still say so.
19. Radar
National radar from NOAA, or the Level II data of any single WSR-88D, decoded on your own computer. This chapter covers the products, the cleaning, the colors and 3D. The tools that find rotation and follow storms are in the next chapter.
19.1 National maps and one radar
National maps use NOAA's MRMS system for the contiguous United States: 240 products covering reflectivity at several altitudes, composite reflectivity, echo tops and heights, precipitation rate and type, rain totals, hail size (MESH), VIL, azimuthal shear and rotation tracks, lightning, flash-flood guidance and more, plus current-conditions and forecast grids (temperature, dew point, humidity, wind, gusts, visibility, ceiling and cloud cover). Detail can be Standard (2 km cells) or Fine (1 km cells).
One radar decodes the Level II data of any WSR-88D site on your own computer. Choose Automatic to use the closest radar to the map center, or pick a site. You can also draw several neighboring radars at once. Every place is drawn from the closest radar that reaches it, at full strength: the nearer radar has the finer beam and sees lower, so the sharpest picture always wins, and a farther radar fills in only where the closer one does not reach.
Canada uses Environment Canada's radar images. Both draws the two together.
19.2 Radar sites: the dome button, terminal radars and sources of your own
The radar sites button on the tool rail puts every radar on the map as a dot with its name: the Weather Service's WSR-88D radars in blue, the terminal radars in amber and other countries' in green. A radar that is down is red, from the Weather Service's own status. Right-click a site to put the radar on it.
Terminal radars. The radar list has the 45 terminal Doppler radars (TDWR) at the large airports, with reflectivity and velocity. They see a short range in fine detail, which helps over a city.
Radar sources of your own. In the one-radar menu, Radar sources of your own takes a polling link (a folder with a grlevel2.cfg, as GR2Analyst uses) and a list of the radars' places. Those radars join the site list in a group of their own with every product of a Level II radar, from stored scans (no real-time feed). Each source is read again once a day.
A radar that is down is passed over. With Automatic, or several radars drawn together, a radar the Weather Service reports down (or one found silent) gives its place to the next closest radar that is on the air, and the choice is made again when one goes down or comes back.
19.3 One radar: products, cleaning and rotation
Live. With Live on, AtmoDeck reads the radar's real-time chunks instead of waiting for a finished volume. The newest whole scan shows in seconds, and a sweep in progress is drawn wedge by wedge as the real radar's scan line passes over it. Whenever no real scan is coming in, a steady scan line keeps turning at the speed you set; with several radars on the map each has its own line, all at the same speed but each from its own place round the circle.
Products. Reflectivity, velocity, storm-relative velocity, spectrum width, differential reflectivity (ZDR), correlation coefficient, PhiDP, KDP, a hydrometeor classification and azimuthal shear, plus composite reflectivity, hail size and signal above noise made from every tilt, and a tornado debris signature: strong echo with a low correlation coefficient and ZDR near zero, kept only within 2.5 km of cyclonic rotation at the same tilt (so hail and the melting layer are left out); echoes of 60 dBZ and more that still correlate, and anything in or within 12 km behind a 63 dBZ core along the beam (the hail spike), are left out too, scored from possible to strong (the published polarimetric signature, Ryzhkov and others, 2005). Level III products from the radar itself (VIL, echo tops, hybrid scan reflectivity and rain totals) load like scans but have no tilts. Click the small "i" in the product picker for what each one means.
Tilt. The list is in order of angle, one entry for each tilt, and the choice is kept as an angle so it is the same tilt in every volume.
Super-resolution. A sweep is drawn from the radar's own gates, so it stays crisp at any zoom. Each product has a Crisp or Smooth switch and a smoothing slider; the default is crisp.
Cleaning. Ground clutter, birds and insects are removed using the correlation coefficient, the texture of reflectivity and other cues, and folded velocities are unfolded (dealiasing). Cleaning is on for everything except reflectivity by default.
Storm motion. Storm-relative velocity subtracts a storm motion you set (direction and speed) or the motion of the selected warning.
Precipitation type. Color reflectivity by rain, snow, sleet and freezing rain, each with its own table.
The radar's own detections (Tilt menu): storm cells with their past track and 15 to 60 minute forecast positions, mesocyclones, and the wind profile as a panel.
Rotation markers, tornado intensity guidance, hail size and the other computed products are aids for presentation. An EF rating is only ever given by a damage survey. AtmoDeck is not an official warning system.
19.4 Fast switching and loading
A single radar (Level II) is downloaded and decoded on your own computer, and it is built to keep up with you:
Switching is immediate. Changing the product, the tilt or the frame shows the new picture in a fraction of a second, and switching product on an older frame stays on that frame instead of jumping to the newest scan.
Only what is needed is downloaded. For the lowest tilts only the start of each archived volume is fetched (it grows when a higher tilt is asked for), and the whole loop's scans are asked for as soon as the list of scans is known. A cold three-hour loop is limited by the download speed of NOAA's archive, typically ten to fifteen seconds.
The rest of the loop fills in behind you. Once the picture on screen is ready, the other frames, products and tilts are decoded in the background, so moving around is instant after the first pass.
Live rescans. The extra low-level passes a radar makes during a volume (SAILS) arrive as frames of their own, so the newest scan is never more than a minute or two old.
How much is kept in memory follows Memory use (Active layers > Loading > Background): Automatic picks Large on a computer with 32 GB of memory or more, Normal with 16 GB and Low below that, and you can choose by hand. The line under the play bar always says what is on the map and how much of it has loaded; with no radar on, it names the layer that is giving the time (a model, an analysis, the satellite).
19.5 The scan line and the live sweep
The Scan line button beside the tilt picker (a single radar only) controls the radar's own marks on the map:
Radar dome at the site and the Scan line turning around it, with Seconds per turn and its color.
Live sweep: when a new scan arrives, it is drawn as the scan line passes over it, the way a radar screen paints, instead of appearing all at once.
The same menu holds the detection options (rotation and debris markers) for that radar.
19.6 Color tables
Every product has a color table, a hide-below floor and its own smoothing. A table chosen for one product colors every product of the same kind (all temperature maps, all reflectivity, and so on) unless you switch that off for a product. You can import GR, GRLevelX and RadarScope style .pal files, build a table with a live preview, edit an installed one and export it. Values show in US units or metric.
The Color tables window (Map appearance > Color tables) lists every kind of value once (reflectivity, temperature, wind, CAPE, hail size and so on) with a live preview, a table picker, Edit, Install a file and Reset. A table chosen for a kind colors every product of that kind, in the national maps, every radar and the models. Dew point, humidity and cloud cover have their own kinds, and a dew point can still be colored like a temperature.
19.7 3D
The 3D button on the tool rail (its arrow opens the menu) turns every tilt of one radar into a volume you can rotate and tilt on the map, for every product. Draw a box on the flat radar and the map zooms and tilts into it, and 3D is made only inside it.
Four looks: Solid volume, Surfaces, Smooth volume or Blocks (section 19.8). Light (direction, world or view, ambient to diffuse), shadow on the ground, brightness, smoothness and drawn alpha curves (which values are dense) can each be set, and curves can be saved by name for each product.
City names float on lines that stand up through the storm; echo in front of a line or a name fades it by how dense that echo is, and the line height has a slider.
Leaving 3D (the checkbox, a right-click on the 3D button, or Back to flat radar) flies the map back to flat and north-up.
The 3D view is of the newest complete volume shown; heights are above the radar, not sea level.
19.8 The looks of 3D, the grid, and seeing through the storm
Look in the 3D menu chooses how the volume is drawn:
Solid volume: an opaque, lit body.
Surfaces: up to six nested shells, one at each edge of the color table or at the levels you type (section 19.10), each as solid as the alpha curve says there.
Smooth volume: soft and glowing.
Blocks: one cube for each cell. They follow the light settings like the other looks.
Density (Opacity for blocks) says how much the volume hides, and Flat picture on the ground underneath keeps the flat radar under it. Show rotation makes a rotating column glow where the wind turns across the beam, with its own Sensitivity and a slider that dims the rest of the wind.
Grid, under Detail, sets how finely the volume is built:
Standard;
Fine: twice the detail, slower to build;
Ultra fine: best with a box drawn round one storm.
The finer grids are held to a budget of cells so a large volume cannot run the graphics card out of memory: over a wide area a fine grid gives less than its full detail, and a box round one storm gives all of it.
More detail
What is behind the storm. The volume is drawn on top of the map's layers, and everything is seen through it by how see-through the storm really is at that spot: the warnings and the map under it, the lines of the city names, the names themselves, the height guides (section 19.11) and the radar's marker. Behind a dense core they fade out; behind thin echo they show through.
Products that have no height of their own. The hail size product, composite reflectivity and the radar's own finished products (Level III: echo tops, VIL, rain totals and the others) are flat pictures. With one of them chosen, 3D stands the storm up in reflectivity over that product on the ground, from the volume nearest in time.
Real clouds is a look of 3D (Look: Real clouds (lit by the sun and the sky, no colors)): the radar's volume drawn as white and grey cloud instead of the color table. With The sky follows the sun it is lit by the real sun, and a sky is drawn behind it.
Precipitation type in 3D. With Precipitation type on, the 3D radar is drawn in the table of each type. Its In 3D choice says how: By height (model temperatures) types every cell by the HRRR's temperature over the radar (snow above the melting level, rain in a warm nose, sleet or freezing rain in the cold air under it), and By the type at the ground draws each column in the type that reaches the ground under it. Hail is drawn as rain. A column whose freezing level is more than 2 km up (a warm-season shower or thunderstorm) is rain from top to bottom. In Archive mode the types are the archive's own of its window.
19.9 Storm sky: the storm as it looks, with its clouds, rain and lightning
Storm sky (the button in the RADAR group of the tool rail) draws a storm as it would look from the ground or from a plane beside it: the clouds from the satellite, the rain, snow and hail falling from them from the radar, and the lightning lighting the clouds. It is a mode of its own, lit for clouds: the looks of 3D are not drawn while it is on. Tilt the map to look at it from the side.
The box. The sky is drawn only inside a box you drag over the storm. Turned on with no box, it asks for one; the arrow beside the button has Draw the box… (then Draw a new box…). The map levels while you drag and tilts in over the box when you let go. The sky's edge is rounded and ragged, not a cut.
Where there is cloud, and how tall. The GOES cloud mask decides where there is cloud (a cold, clear ground is not one) and the measured cloud-top height sets how tall it is; where those are missing, the infrared cloud tops are used. Every cloud the satellite sees is drawn: towers over the radar's storms, flat-topped anvils spreading from deep storms, decks and low cloud, and wispy cirrus high up. Cloud tops rise and fall about the measured height, and overshooting tops punch up as domes over each deep storm's highest echo, up to 2.5 km above the anvil.
The HRRR’s sky (Cloud base, layers, cloud types and up- and downdrafts from the HRRR model): the cloud base of each column, the layers (a deck thins to gaps where the model's air is dry), ice clouds drawn as cirrus, and the rising and sinking air. Without it the base is the Cloud base slider.
Rain, snow and hail fall from the clouds where the radar has echo, as a see-through veil that thickens with the echo (faint at 25 dBZ, a grey curtain at 40, thick only in the heaviest cores), with the precipitation type deciding which. Radar cores in the clouds lets the strong echo glow through the cloud in the radar's colors, from the dBZ you set and as strongly as you set.
Lightning (Lightning lights the clouds as it happens) is the GOES-East lightning mapper's flashes lighting the cloud from inside; Channels to the ground draws a stroke under the brighter ones. Flash brightness sets how bright.
Light. With The sky follows the sun (Globe, sky and night lights, section 21.16) the clouds are lit by the real sun, cast a shadow on the ground and go dark at night. At night the Moon lights them from where it is and as brightly as its phase, and the towns' real lights (NASA Black Marble) glow on the cloud bases. Haze over the land sets the air between you and the ground.
Moving lets the rain fall and the clouds drift; Density, Brightness and Height exaggeration are in the same menu. The status line under them says what the sky is made from now.
It works in Archive mode too: an old storm gets its clouds and lightning from NOAA's archive of the GOES pictures and flashes of its time. The clouds are an estimate made from the satellite, the model and the radar, not a photograph.
19.10 Surfaces in 3D: choosing the levels of the shells
With Look set to Surfaces (nested shells) in the 3D menu, Shell levels appears under it. Type up to twelve values in the product's own units, separated by commas (for reflectivity, 20, 35, 50, 60; for a wind product, the inbound and the outbound ones, -50, -30, -10, 10, 30, 50), and a shell is drawn at each. Leave it empty and the shells are found for you, one at each edge of the color table.
Each product keeps its own levels: reflectivity's are not velocity's.
For a wind product, a level below zero wraps the stronger wind toward the radar, and one above zero the stronger wind away from it.
A level you chose is always drawn at least faintly, so the shells inside it show through. The Alpha curve makes a level more solid.
19.11 Height guides, freezing level and winds in 3D
The 3D radar has guides so a viewer can read heights at a glance. Each has its own switch in the 3D menu:
Height ruler, standing at the near left corner of the 3D box, in thousands of feet, with the temperature at each height.
Freezing level (32 °F) and the hail growth level, drawn as level outlines through the box.
Wind barbs by height at the near right corner: the radar's own wind profile when it has one, otherwise the model's.
The guides stay at the corners of the box as you turn and tilt it, and the temperatures and winds come from the newest model column at the radar. Cloud look draws the weak echo as a pale cloud with the storm's cores in color. In the correlation coefficient product, 3D shows the low values that mean debris most strongly.
19.12 Wind streaks through the storm in 3D
The 3D menu’s Height ruler, freezing level and winds section has Wind streaks through the storm (from this radar’s velocity). It is off until you turn it on. The streaks are ribbons that follow the wind through the volume: AtmoDeck fits the wind at each height from the radar’s velocity, and reads it again as the tilts of a live scan arrive. A line under the switch says where the wind came from: the fit, the radar’s wind profile (VWP), or the last scan.
Streak color.Rising and sinking: orange-gold where the air rises, blue where it sinks, dimmed where it is level, so the updraft and downdraft stand out against the cloud. The way it blows: blue for the wind turned most to the left, through green and yellow, to red for the most turned to the right; the status line names the two ends.
Rising and sinking, drawn stronger (1 to 15 times, 6 at first) draws the up and down motion larger than it is read, since it is only a few meters a second against a wind of 15 to 25.
Streak length, Streak opacity and Streak density set how long, how solid and how many they are. All of it is kept in your settings.
The streaks are not drawn on the round earth or under Storm sky, and keep inside the 3D box when there is one.
19.13 Cross sections
The Section tool draws a cross section through the radar or a model: drag a line across the map, then drag either end, the whole line or the upright curtain to move the slice live. Choose On map, Panel or Both in the Section menu.
Heights are in thousands of feet and the distance along the line is marked.
Temperature lines in the panel (32 °F, the hail growth level and every 18 °F) and Wind barbs in the panel come from the model columns along the line; each has its own switch.
The panel can be made large with the button in its corner, and saved as a picture (it goes to Pictures\AtmoDeck\graphics).
19.14 Soundings that follow the cursor, and the meteogram
The Soundings button on the tool rail turns on a sounding that follows the cursor: move the mouse and the skew-T changes with it at once. It can show one model's forecast column, up to four models on one chart, the SPC analysis or the nearest observed launch. A sounding from a forecast model has its time on the line under the picture, next to the place: pick any hour of the model run, or step with ◀ and ▶, and the sounding is read for that hour at the same spot (Map time, or Back to the map’s time in the button’s menu, goes back). With a model on the map the sounding reads that model; step the map to another hour, or put another model on it, and the sounding follows. Create a sounding here on the right-click menu also reads the model on the map at its time, and the SPC’s analysis when there is none.
The button's dropdown also has the Box sounding: drag a box over the map (Esc cancels) and the model’s columns over it, 49 spots on a 7 × 7 grid, are averaged into one profile of temperature, moisture and wind. Its panel chooses the model (the model on the map, if there is one) and the Valid time from that model’s latest run, starting at the map’s time, with ◀ and ▶ to step an hour; Draw another box starts over. The box can be from 5 km to 10° across, below 75° latitude.
Right-click the map and choose the meteogram for a forecast of that point from the National Blend of Models: temperature and dew point, the chance of rain and how much, wind and gusts, snow, and thunder, hour by hour, with the high and low of each day.
The Soundings button turns the sounding on, following the cursor; the button again, the cross in the sounding's bar or Esc turns it off and lets a pin go. There is no second Soundings mode switch in the menu.
19.15 Snow, sleet or rain here
Right-click a spot on the map and pick Explain the weather here › Snow, sleet or rain here. A card shows what precipitation falling at that spot would land as, and why: snowflakes fall through the air above it, melting where it is above freezing and refreezing in cold air under a warm layer, beside the temperature by height with the warm nose marked.
Lands as: snow, rain, sleet, freezing rain or a mix, with the warm and cold layers’ depths and the melting and refreezing energies against the thresholds of the energy-area method (Bourgouin 2000).
It is one of the Explain cards (section 19.16) and works like the others: Source (Auto reads the SPC’s current mesoanalysis on the latest hour in the United States, otherwise the model on the map), Valid to pick a forecast hour, Play again and Save loop in the bar under it, your logo, the little map in the answer panel, the Output in Live mode, and Over a box, where the worst spot is the one whose precipitation is the most dangerous (freezing rain, then sleet, snow and rain).
The card says what would fall if precipitation falls; the radar says whether it does.
19.16 Explain the weather here
Right-click a spot on the map and open Explain the weather here. Each item draws an animated card for that spot in the popup box, saying in plain words what the air there will do and why:
Snow, sleet or rain here: what precipitation lands as (above).
Storm ingredients: moisture, instability (CAPE), the cap and the wind shear, and whether storms can go up and organise.
Hail growth: the updraft holding stones in the growth zone between −10 and −30 °C, a rough size aloft, and how much melts below the freezing level. Where a Weather Service warning over the spot gives a bigger hail size, the card gives that size at the ground and names the warning.
Lightning: the charging zone from 0 to −20 °C, where ice and graupel mix, and whether updrafts there are strong enough to flash.
Downbursts: rain cooling the dry air under the cloud and sinking (DCAPE), and how hard the outflow can hit.
Fog: whether fog forms tonight, when it starts, how thick it gets and when it burns off, from the National Blend of Models’ hours.
Lake-effect snow: cold air over the open Great Lakes, the fetch along the wind and whether the bands land on the spot.
Gusts: how deep the air mixes during the day and the fastest wind inside that layer, which eddies bring down to the ground (named by the NWS’s wind advisory and high wind warning).
Flash flooding: the water in the air (precipitable water), how slowly storms move and whether new cells keep forming over the same place (training), and the rain that fell against the River Forecast Centers’ flash flood guidance.
Rotation: the hodograph, storm-relative helicity and the spin the inflow carries into an updraft. The Full edition adds the SPC’s significant tornado parameter.
Snow quality: whether snow is fluffy or wet and heavy, from the dendritic growth zone (−12 to −18 °C) in the column and the Blend’s snow-to-liquid ratio.
Fire weather: humidity, wind, how high the air mixes and where smoke would go (the Blend’s mixing height and transport wind). It does not know how dry the fuels are.
Frost or freeze: tonight’s low hour by hour from the Blend, with frost, freeze and hard freeze as the NWS names them.
Heat stress: the heat index hour by hour from the Blend, with the NWS’s categories, and the Blend’s wet-bulb globe temperature when it has one.
River flood: the nearest river gauge within 60 km (from the National Water Prediction Service), its last three days and forecast crest against its flood stages, and the rain that fell.
More detail
Storm day (at the bottom of the menu) plays the storm, hail, lightning and downburst cards one after another for the spot, and sends each one to the Output in Live mode. Esc stops it.
Over a box, at the top of the menu, switches the cards from the spot you right-clicked to an area: pick a card, then drag a box on the map (Esc cancels). Nine spots in the box are read. The bar under the card chooses Worst spot, the spot whose answer is worst (then the one with the highest main number, such as the energy or the gust), or Typical, the columns of all the spots averaged on pressure levels (the Blend’s hours averaged hour by hour).
When a card is read from a forecast model, the bar under it also has Valid: the hours of that model run (every hour for two days, then every 3 hours, then every 6). Pick one and the card is read again for the same spot or box at that time; the map’s own time and playback do not move. The fog, frost, heat and snow cards read the National Blend of Models’ hours, so theirs is From, the hour they start at. A card from the SPC’s latest analysis or from a river gauge has no time to pick. The ◀ and ▶ buttons on each side of it step to the hour before or after. The picker is on the Console only, not on the Output.
With a forecast model on the map, Auto reads that model at the map’s time, and putting a model on the map brings a picked source back to Auto. The river card over a box shows the gauge that is highest against its flood stages, now or in its forecast. A card over a box names the area rather than a town, such as Southeast Iowa, Southeast Iowa and western Illinois when the box spans two states, or Iowa when it holds most of the state; worst or average of 9 spots goes on the line beside it, with the town of the worst spot when it fits. At this spot switches back; the choice is kept.
The card names the nearest town, or how far and which way it is from one (such as 40 mi E of Mayhill, NM); only a spot on open water far from land shows its coordinates.
Save loop, in the bar under the card, saves the card alone: its animation once from the start, held still for two seconds at the end, with the Powered by AtmoDeck badge in a strip under it (unless you switched the badge off). The list beside it chooses MP4 or GIF (800 pixels wide, looping forever); the choice is kept. The file goes to Pictures\AtmoDeck. The card on the map keeps playing while it records.
Timeline, in the bar under every card, draws the card’s answer hour by hour for its spot: a colored strip of when the conditions are what, the card’s main numbers as lines, the worst hour marked and a line for now. A card read from a model reads the same model again at up to nine of its hours over the next day; the fog, frost, heat and snow cards use the Blend’s own hours, and the river card its gauge’s readings and forecast against the flood stages. ◀ Card goes back to the card. The Output shows the timeline too, without the bar, and Save loop records it like a card.
To share a card in an upright, square or wide frame, use Clip of the card in the Export menu (section 18.17).
Your logo sits at the top right of every card: the map header’s own logo when you gave it one, otherwise your station logo from {{ui:Look > Logos}}, even with the header’s logo switched off. It is on the card on the map, on the Output, in Save loop and in Clip of the card.
Under the numbers in the answer panel, a little map shows where the card is for: the spot, marked with a dot, or the box you dragged, outlined, with the state and county lines around it and the worst spot marked (the typical air has no dot, since it is the whole box). Where no map can be drawn, such as a spot out at sea, the panel explains the answer in a few sentences instead.
Source (under the card): Auto reads the SPC’s current mesoanalysis on the latest hour in the United States for the snow, sleet or rain, storm, hail, lightning and downburst cards, and the model on the map otherwise; pick the mesoanalysis or one model instead, and AtmoDeck remembers it. The frost, heat and river cards have no picker: they read the Blend’s hours or the gauge. Each card names the numbers and the method it used; none gives a percentage chance.
Play again replays the animation. In Live mode the Output shows the same card without the Source picker; Esc or Clear all takes it off.
19.17 What the wind profile says: storm motion, shear and helicity
The one-radar wind profile panel (Wind profile: the winds by height for the last hour) now reads the profile for you. Beside the barbs it lists, for the newest volume, with the change since about half an hour before:
Storm motion: the expected motion of a right-moving supercell;
0-1 km and 0-6 km shear, in knots;
0-1 km and 0-3 km SRH (storm-relative helicity).
Heights are taken above the radar, from the radar's own elevation. A layer the profile does not reach shows a dash instead of a guess: the radar measures no wind where there is nothing in the air to return its beam.
19.18 Lightning
Lightning (a map overlay in + Add product, section 18.3) draws every flash the GOES-East satellite's lightning mapper sees (in-cloud and to the ground, placed to about 8 km, about half a minute behind) as a bolt where it struck, over the radar. A new flash bursts on; its bolt stays for the time you choose (5 to 30 minutes) and then fades. Each flash is a bolt, a plus or a pulsing circle, light yellow with a soft round glow; the color, glow color, glow strength, size and a density slider (fewer flashes, the same ones from frame to frame) are yours, and they can cool to orange and red as they age. Lightning moves with the timeline: on the newest scan it is live, and on an older one it shows the flashes of that time. Sea surface temperature and wave height (under Sea and surface observations) are cut off at the coast, so they show over the water only, on any base map.
19.19 The lightning activity card
With the lightning layer on, the lightning activity card counts the flashes in view over the last minutes. It is its own box on the map: Show lightning activity card, then place it with Activity card left / right and up / down. Each flash can be drawn as a bolt, a plus sign or a pulsing circle, with a density setting for how many are shown and how far back they go. The preview and the Output show the same flashes at the same moment.
A different place on the preview (Lightning) puts the card somewhere else on the Console’s preview than on the Output, so it is not over what you are working on.
20. Rotation, storm tracks and tornado tools
Everything that finds rotation, follows storms and says what they are heading for: the rotation markers and AtmoSpin, storm tracks with arrival times, the Unwarned in the path check, AtmoDeck Insight, ProbSevere, the people inside a warning, and AtmoCast, AtmoDeck's own severe weather outlook. All of it is made from public data as a guide for a presenter; none of it is a warning.
20.1 Rotation markers: where they come from
Rotation markers are rings on the map where the radar shows a storm turning. They are radar-indicated rotation: what the radar sees, not a confirmed tornado and not a warning. There are two kinds, by where they come from:
One radar (Level II). With Mark rotation on and one radar chosen, the markers come from a detector of AtmoDeck's own that reads the whole radar volume, whichever product and tilt is on screen. It is described next (section 20.3). Each marker carries an AtmoSpin value (section 20.4), and its card shows the signs of a tornadic supercell (section 20.5).
The national maps. On the national radar, groups of strong azimuthal shear in the national shear picture, inside real echo, get a ring and a label, coloured by strength (weak, moderate, strong, extreme). These are simpler and have no AtmoSpin value or card of their own.
A ring turns at a speed that grows with the strength of the rotation, and stands up as a funnel when the map is tilted. Sensitivity sets the weakest rotation that is marked. Markers need rotation inside real echo, and a tornado warning that has none of its own gets the strongest weaker group inside it, marked and labelled as such.
20.2 Rotation markers on the newest scan
Rotation markers are made from the scan on screen, and the newest scan is still arriving. Three things keep a marker there while that happens:
They follow the scan as it grows. The rotation is looked for through the whole storm, and as each higher tilt arrives the markers of the newest scan are made again.
A new sweep is looked at straight away. Each new sweep of the lowest tilt gets markers of its own at once.
A marker is not dropped because a scan has only just begun. For three minutes from the start of the newest scan, a rotation that was marked on the scan before, and has no marker within 8 km of it yet, is kept where it was. By then the scan has its middle tilts and its own answer; a rotation that has really gone, goes.
The marker's card gives its strength, its numbers and its trend. It does not say which way the rotation turns.
20.3 The one-radar detector
With Mark rotation on the map on and one radar chosen (Level II), the markers come from a detector of AtmoDeck’s own that reads the whole radar volume, whichever product and tilt is on screen:
Shear that folding cannot fool. A Doppler radar wraps a wind faster than it can measure round to the other sign. The detector takes the difference between neighbouring gates, which is small whatever fold they are in, so wind at the radar’s limit does not make false markers.
A fitted vortex. Round each candidate it fits a model of a turning column (solid rotation in a core, falling off outside it) on an even background, smeared across the beam as the radar smears it. That gives the centre, the rotational velocity, the core width and how much of the wind the vortex explains. A straight line of shear (a gust front) is fitted too, and where that explains the wind as well, nothing is marked.
The whole column. The fits of every tilt up to 12 degrees are joined: how deep the rotation is, its base and top, in how many tilts it shows.
Through time. Each marker is followed back through the scans of the loop: how long it has been there, whether it is strengthening, where it is moving.
What it is. A tornado signature (strong, tight, near the ground, or with debris: decided by the tornado probability, 60% or more), a mesocyclone (deep and wide: a circulation wider than 3.5 km, or than 2.2 beam widths far from the radar, is a mesocyclone unless there is real debris under it), or low-level rotation. A hail core and its spike are not counted as debris or as a drop in the correlation. Every one is radar-indicated: it is what the radar shows, not a warning and not a sighting.
More detail
The marker’s label is what it is and its AtmoSpin Value (set under Label). Click a marker for its card: the type, rotational velocity near the ground and aloft, core width (it says when the vortex is narrower than the beam), depth, debris signature, tornado probability, how long it has been seen and its trend, where it is moving, and how well the vortex fits. The tornado intensity guidance (section 20.6) follows. Sensitivity sets the weakest rotation that is marked (12 marks from about 20 kt).
How good is it? It was tried on 128 radar volumes from 14 past storm days (Moore, Joplin, Tuscaloosa, Nashville, Mayfield and others, and days with hail, a derecho and tropical rain bands and no tornado) against the SPC’s tornado tracks. The new tornado signatures found 54% of the tornadoes while they were on the ground, with 24% of them false alarms; the markers before found 50% with 60% false alarms. Within 60 km of the radar it found 82%; beyond 120 km only 9%, because the beam there is kilometres wide and high above the ground. The thresholds were set on those same storms, so expect a little less on new ones. The markers of the national maps (from the national shear picture) are unchanged.
Sidelobes are not rotation. A strong storm can leak into the weak echo beside it through the radar beam's sidelobes and paint a false couplet there. A low couplet (under 3.5 km) is dropped when one of its sides is in the clear-air inflow (under 20 dBZ) and either a strong core hangs above it in the higher tilts (50 dBZ or more, 35 dB over the weak side) or its two sides' speeds are lopsided (two to one). Debris and hook checks keep it to themselves. The strength of a rotation is said once, in the words of its AtmoSpin number, on the marker and on its card alike.
Phantom rotation. Low-level rotation must begin near the lowest the radar sees at that place and be strong in two tilts, or in one where it is clearly a vortex and not a straight line of shear. A circulation under both sidelobe signs is kept only with real debris, and a weak side before the radar has scanned above it is undecided, not a marker, until the next look. On 61 volumes of past tornadic and non-tornadic storms every tornado signature and every mesocyclone was kept, while low-level markers fell from 60 to 39.
A rotation marker stands where the rotation is lowest: a circulation is joined to a lower one turning the same way within 5 km, and the marker is put on the lower one, as the place nearest the ground.
20.4 The AtmoSpin Value, the environment and the hook echo
Every rotation marker from the detector has an AtmoSpin Value from 0 to 10. Six tenths of it is the tornado probability and four tenths is the rotational velocity (40 m/s, about 78 kt, or more counts in full). A number near 10 is rotation that is both violent and very likely tornadic; a strong mesocyclone aloft that is unlikely to make a tornado sits in the middle. The card gives it in words: Weak (under 2), Moderate, Strong (4), Intense (6) and Extreme (8 and over). Once a marker has been followed through the scans of the loop its history is part of the probability.
Inside a tornado warning the Weather Service says is observed (a tornado seen on the ground), the card gives the tornado chance as 100% and says Inside an observed tornado warning; the AtmoSpin Value still uses the detector’s own probability.
The hook echo. Seen from the centre of the rotation, a hook is one unbroken arc of echo of 35 dBZ or more covering between a fifth and three quarters of the way round, with a core of 45 dBZ or more in it and a notch of clear air on the other side. Rotation buried in a core, or out in clear air, is not one. The card says Yes, Partly or No.
The environment. The HRRR model at the hour of the radar volume, on a 20 km lattice round the radar: the significant tornado parameter, low-level helicity, cloud base height and SHERBE, taking the most favorable air within about 40 km of the marker. The card shows them. If the model is not available the marker is made without it.
How good is it? Tried on 64 past storm days (446 radar volumes, the HRRR environment for all of them) against the SPC’s tornado tracks, the tornado signatures at their best setting found 31% of the tornadoes with 58% false alarms (critical success index 20%; the old markers 15%). 115 of the hits came before the tornado touched down, 11 minutes ahead in the middle case. The environment and the hook echo each add only a point or two, which is within the noise of the test, and false alarms are still the main weakness. Models fitted to these storms did not beat the built-in one on storms they had not seen, so the built-in one is used. It is a radar-indicated marker, not a warning.
20.5 Dual-polarization signs on the rotation markers
The rotation detector also looks round each vortex for the signs a tornadic supercell shows in the dual-polarization moments: the ZDR arc (a crescent of high differential reflectivity in the inflow, big drops sorted by the winds), the KDP foot (a patch of heavy rain, high specific differential phase, beside the core) and the correlation drop (low correlation coefficient where debris is lofted). Each shows on the marker’s card as Yes, Partly or No, and adds to the tornado probability. They are read only where the radar gives those moments. Their weights are set by reasoning, not by fitting, and tried on 64 past storm days adding them changed nothing that could be measured (the score was 20% with them and 20% without), so treat them as a help to the eye rather than a better probability.
20.6 Tornado intensity guidance
Click a rotation marker in the preview. AtmoDeck opens that radar's volume and measures the couplet at the lowest tilt (the strongest inbound and outbound winds side by side, which gives the rotational velocity, Vrot) and how high a tornado debris signature reaches over it (reflectivity of 30 dBZ or more with a correlation coefficient of 0.85 or less). It reads the tornado intensity guidance tables for those two numbers and shows the most likely EF rating and peak wind in a badge under the marker, on the preview and the Output (click again to take it off). The Console line gives the whole story: Vrot, the debris height and the chance of each rating. Ground clutter and wind farms are recognized and not rated.
An EF rating is only ever given by a damage survey. The guidance is an aid for a presenter. AtmoDeck is not an official warning system.
The same guidance is a panel of its own in the marker’s story box, with the chance of each EF class (section 18.16).
20.7 Storm tracks
The Storm button on the tool rail has two tools. Cell: click a storm. Line: drag along a line of storms. Each puts a marker, a track, a cone of uncertainty and time marks on the map, in the preview and on the Output. The speed is measured automatically by sliding the reflectivity around the storm over the picture from 10, 15 and 20 minutes earlier, or set by hand (direction and speed); drag the round handle at the tip of the arrow to aim it. A storm inside a warning that gives its motion moves the way the warning says. Click a storm to open its editor. The towns in the way appear as dots and names on the map, and in the Storm Arrival Times widget (see section 20.9). Storms are not saved; they last until cleared or the app closes.
A rotating storm that the radar is following also has a path of its own, and the towns in it can be checked against the tornado warnings on the map: see section 20.10.
The places listed for a storm are only those inside the track that is drawn (the cone, or the area a line sweeps), and when more lie in the way than the list has room for, they are spread from the first to be reached to the last, a city before a town before a village in each stretch of time, so a long track is not filled with the first few minutes. The list looks up every city, town and village along the track, whether or not its name is on the map at that zoom.
20.8 A storm’s story
A storm that is being tracked keeps its whole life (up to eight hours): its hail, tops, VIL, lightning, rotation and warnings at every picture. Its card has two views:
Now: what the storm is doing at this moment.
Story: how long it has lived and how far it has gone, its peaks, the warnings it has had, the SPC storm reports near its path, a sparkline of its strength and a timeline of what happened when.
The Output can show the same Story view.
20.9 The Storm Arrival Times box
One box that lists the cities each storm will reach, soonest first: place, clock time and minutes. It is a box on the map itself, like a warning box: it starts at the left of the map, and you drag it on the Console preview to where you want it (the Output puts it at the same place). Choose how many rows to show (1 to 12), how many cities per storm (default 8), which storm each city belongs to, and click a place in the list to leave it out. Only places the drawn cone reaches are listed. The box shows on the Output and on the Console preview. On the Output it stays in the part of the map the layout’s widgets leave free, so it is never under a sidebar or the bottom bar, and a clean screenshot has it where the preview does (tick With the storm arrival times). Size of the box, in the list’s settings, makes it larger or smaller (50 to 250%). It can match the broadcast look or use its own colors and a Google Font.
20.10 Unwarned in the path: towns with no tornado warning
The rotation markers say where a storm is turning. The storm tracks say where a storm is going and when it gets there. Unwarned in the path puts the two together with the warnings on the map, and answers one question a presenter needs on a bad day: is a rotating storm heading for a town that has no tornado warning over it?
A staged example. The storm's path is red and four towns in it have no tornado warning over them. Moore, at the top, is under a tornado warning, so it is not listed.
How it decides
The storms it follows are rotation markers from the one-radar detector (section 20.3) that the radar has tracked for at least two scans, so that they have a heading and a speed (at least 3 knots), and whose AtmoSpin value (section 20.4) is at least the limit you set (3 to begin with). Rotation turning the wrong way (anticyclonic) is ignored.
The path is the cone of the storm tracks (section 20.7), as far ahead as you set (10 to 60 minutes; 30 to begin with). A heading measured from only two scans is rough, so the cone is made 60% wider for a storm followed for two scans and 25% wider for three; from four scans it is as the storm track settings say.
The towns are every city, town and village inside that cone (the same places the Storm Arrival Times list uses, section 20.9), with the minutes until the storm gets there.
The cover. For each town it asks whether a tornado warning covers it at the time the storm gets there. A warning that will already have ended by then does not count. A town that is covered is never listed: the warning already says it. A town covered only by a severe thunderstorm warning is listed, marked SEVERE T-STORM WARNING ONLY; a town with no warning at all is marked NO WARNING.
More detail: What you see, Turning it on, What it needs, and what it cannot do
What you see
On the map and the Output. The storm's path in red with a dashed edge, a red dot at each town (orange when only a severe thunderstorm warning covers it), and a label with the town, the clock time, the minutes and the words NO WARNING. Because it uses the same picture as the storm tracks, it is on the Output with no extra setting.
In the bell. When a new set of towns appears, the bell at the top of the Console says so in one sentence, for example A rotating storm (AtmoSpin 7.8) heading E at 46 mph will reach Newcastle in 19 min and Moore in 23 min, with no warning over them. It speaks at most once in five minutes, so a producer who is on another page still hears about it.
In the menu. The same sentence is under the switch, kept fresh while it is open.
Turning it on
Open the Storm menu in Map Studio (or the Storm tracks row of Active layers) and switch on Show towns in the path of a rotating storm that no tornado warning covers. It is off until you switch it on, like every layer. Then set:
Look ahead: 10 to 60 minutes.
Only storms with an AtmoSpin value of at least: 0 to 9. Lower it to see weaker rotation, raise it to hear only about the strongest.
Towns to list: 1 to 12.
Smallest place: cities only, towns and cities, or villages too.
A severe thunderstorm warning alone is not enough: on, towns under only a severe thunderstorm warning are listed (marked as such); off, a severe thunderstorm warning counts as covering a town.
What it needs, and what it cannot do
The live radar of one site (Level II) with Mark rotation on. It does nothing on a replayed loop, on an old frame, in Archive mode or on a forecast frame, because a path drawn from an old scan against today's warnings would be wrong.
Two scans, about ten minutes. A storm the radar has only just found has no heading yet, so it is not followed until it has been seen twice.
A storm that is going to turn. The path is a straight line along the heading so far. A storm that turns, or that the radar loses, will not do what the path says.
The edge of the radar. Far from the radar the beam is wide and high, so rotation there is weaker and the heading rougher.
It is a prompt, not a warning. It says a rotating storm is going where no tornado warning is, and nothing more. Whether to warn is for the Weather Service. Use it to call them, or to tell your viewers to watch the sky; do not use it to say a town is safe because it is not listed.
20.11 AtmoDeck Insight
Storms (Insight), a map overlay in + Add product, is analysis made from the live radar. It is made from public radar data and shown as guidance for a presenter. It is not a warning.
Storms. Storms are found in the national reflectivity picture, split where a line has separate cores, named, and followed from picture to picture, with a speed measured from where each has been. Each gets a score from 0 to 100 made of the strongest echo, the water held in the column (VIL), the hail size estimate, the height of the echo top, the rotation and any jump in the lightning, each counted when it is known. Each is a dot in the color of its threat level (Ordinary, Strong, Severe, Intense, Extreme; the same colors on the map, in the Top storms list and on its card), with its name and score. With paths on, each shows where it has been and where it is going in the next hour, marked every 15 minutes inside a cone for the doubt (paths off hides both), and the dots move with the timeline; the strongest are given lists of the places they reach like a storm you placed by hand.
A storm's card. Click a storm on the preview for its card (the Output opens it too; its size is set in the Insight menu): strongest echo, estimated hail, the water in the column, how high it reaches, rotation, lightning jump, how it is moving, how long it has been followed, and the places it reaches in the next hour with the minutes to each. The Output shows the same storms, with the same names, as the Console.
These are computed aids. They can be wrong, and none of them is a tornado, hail or flood warning: keep using your official channels for safety decisions.
20.12 The Top Storms list
With Insight's storm cells on, a second box under the arrival times lists the strongest cells: name, score (with an arrow when it is rising or falling fast), the way and speed it is moving and the hail size estimate. It takes the look of the arrival box, and shows on the Output only.
20.13 ProbSevere, past tornado paths and the warning scorecard
ProbSevere (NOAA and CIMSS) puts a polygon round every storm the radar sees and gives it a chance, for the next hour, of severe weather, a tornado, hail and damaging wind, made every two minutes from the radar, the lightning and the model’s air. Colour the storms by any one of the four (or the highest), hide the weak ones, and put the chance beside each. Click a storm for its card. A bolt marks a lightning jump: a storm whose flash rate climbs faster than twice the spread of its recent changes, once it flashes ten times a minute or more (ProbSevere’s own flag is used too). A jump often comes minutes before severe weather. It is a model’s chance, not a warning.
Past tornado paths draws the Storm Prediction Center’s record of every tornado since 1950, from where it touched down to where it lifted, coloured by EF rating. Choose the years and the lowest rating, or show what has happened on today’s date in any year. The record is read once (about 8 MB) and kept for two weeks. Archive mode has its own Tornado tracks and DAT damage for a past event.
The warning scorecard scores a Weather Service office’s tornado, severe thunderstorm or flash flood warnings over the last 7, 30 or 90 days, using the Iowa Environmental Mesonet’s verification against the storm reports: the share of tornadoes that were warned (POD), the share of warnings with no report (false alarms), the overall score (CSI), the average warning time and the latest warnings with what became of each. The office is the one over the middle of the map unless you choose one.
20.14 AtmoCast: the severe weather outlook, days 1 to 14
AtmoCast outlook (tornado, hail, wind), days 1 to 14 (AtmoDeck), a map overlay in + Add product, draws AtmoCast, AtmoDeck’s own forecast of the chance of a tornado within 25 miles (40 km) of each place in the lower 48 states, for any of the next 14 convective days (12 UTC to 12 UTC). For Days 2 to 9 it reads each forecast model at 18, 00 and 06 UTC (1 pm, 7 pm and 1 am Central), the storm hours of the day, rather than at one moment. Its name is in the map’s header like any other product, titled by the date of the day rather than its number (AtmoCast Mon, Nov 2); the Day list shows both. It is drawn as a heatmap: the color deepens with the chance, from 1% to 60%, and fades out where the chance is under 1%. Click anywhere for the chance there. Its row in Layers has the tabs a model layer has: Fill (the heatmap: the day, its opacity and the scale), Line (a line at each chance, 2, 5, 10, 15, 30, 45 and 60%, in the heatmap’s color for it or one color, with the chance written along it) and Point (its chance above each city, the same way a model layer’s readings do and in the same look). Pick the day under the layer’s settings; days 4 to 8 are marked low confidence and days 9 to 14 little skill. It is made on the computer, up to about 15 seconds the first time a day is shown after new forecasts come out, then kept, and needs the internet to read the forecasts.
How it is made. AtmoDeck reads the newest runs of several forecast models and turns them into the chance of a tornado with a model of its own, fitted on several years of forecasts against the Storm Prediction Center’s tornado reports, one for each day ahead.
More detail
How good is it? Tested on years it had not been fitted on (each year left out in turn), it picks out the places where tornadoes happened far better than the time of year and place alone: about 0.97, 0.96 and 0.92 for days 1, 2 and 3, 0.92 to 0.88 for days 4 to 8, against about 0.81 for the time of year and place (0.5 is no skill, 1 is perfect). From day 9 on it is little better than the usual for the time of year. The chances up to about 15% match how often tornadoes came. It is cautious: it rarely goes above 30% and under-forecasts the largest outbreaks. It is an experiment, and the SPC’s outlook is the one to use for a decision.
AtmoCast in Layers has the tabs of a model layer: Fill (the heatmap, with Draw the fill, the day, the opacity and its scale), Line (a line at each chance from 2 to 60%, in the heatmap's color for it or in one color, with a width and the chance written along it) and Point (its point readings). The point readings put the chance above each city, blended between the cells as the layer's card reads it, with the one look every product's readings share; they take the heatmap's colors when the readings use the table's colors. AtmoCast is named in the header by the date of the day (AtmoCast Mon, Nov 2), the layer list, the legend and the card, like any other product.
It loads about three times faster than before: a day's models are fetched at the same time, so Day 1 from nothing takes about fifteen seconds.
One outlook, six hazards. AtmoCast's first choice, Hazard, picks what the chance is of, within 25 miles (40 km) of a place: Tornado, Large hail (1 inch or more), Damaging wind (a severe wind report), Significant severe (hail of 2 inches or more, wind of 75 mph or more, or a tornado of EF2 or more), Any severe weather (a tornado, hail of 1 inch or more or damaging wind) and Flash flooding (a Weather Service flash flood report). The fill, line, point readings, legend, header name, titled by the date of the day (AtmoCast hail, Tue, Oct 27), card and the record in How far to trust it follow the hazard chosen; each hazard keeps its own record.
Each is made from the same forecast models as the tornado, by a model fitted on years of forecasts against the Storm Prediction Center's reports (the Weather Service's flash flood reports for flooding, with the rain the GFS, NAM and GEFS forecast), and tested on the days since August 2025, which it was not fitted on. On those days every hazard ranked places better than the time of year and place alone: for Day 1, 0.96 to 0.98 against 0.84 to 0.87 for the four severe-weather hazards and 0.93 against 0.87 for flooding. The chances are small numbers because such an event within 40 km of a given place is uncommon; the middle chances matched how often it came, and the top ones are less sure. Flash flooding goes to Day 5; the others to Day 14, and from Day 9 are little better than the usual for the time of year. A significant-severe day cannot count tornadoes of EF2 or more that the Center has not yet rated, so it is scored on hail and wind until they are. It is AtmoDeck's own experimental outlook, not the Storm Prediction Center's or the Weather Prediction Center's: use theirs for a decision.
20.15 AtmoCast: its closest past days and its record
The closest past days show the real number of tornadoes and the strongest rating from the Storm Prediction Center's final record for days through 2024. A 2025 day shows its preliminary reports, marked not rated yet: those count some tornadoes twice.
How far to trust it, under the layer's settings, gives the test it was made with, and its record on this computer. Each day's outlook is kept and, the next morning, scored against the SPC's reports: how many places had a tornado within 40 km, how many were inside the 2% and 5% lines, and how often each chance came true, over the last 30 days. Once the outlook has been used, Day 1 is made every afternoon so quiet days count too. A few weeks are needed before these numbers mean much.
The record is kept for a year. Beside the last 30 days, How far to trust it adds a line for the season here once more than 30 days are scored: the days scored, the days with tornadoes, how many of the places that had one were inside the 2% line, and the ranking.
21. Satellite, models and the atmosphere
The seven geostationary satellites, the weather models, and the maps worked out from them: mesoanalysis, composite parameters, space weather, terrain and the globe.
21.1 Satellite
The satellite products (Radar & Satellite in + Add product) draw the seven geostationary satellites with a full-disk picture (GOES-East and West, Himawari, GEO-KOMPSAT-2A and Meteosat) with every picture CIRA and RAMMB SLIDER make: the individual bands, GeoColor and other multispectral pictures, RGB composites, cloud products, the lightning mapper and water vapor. Choose an Area: the full disk, CONUS, Korea, or the moving mesoscale boxes. The satellite follows the radar loop, or plays by itself when there is no radar; new pictures join every minute, and a tile that fails is tried again. With Smooth on (the play bar) each picture fades into the next, and the timeline moves with the satellite when it plays alone or is chosen as the Timeline. One-channel pictures can take any color table, and infrared windows read as temperature; a palette with no unit whose values are all between 0 and 100 (such as cyclonic IR) is read on the picture's own 0 to 100 scale. Edit colors changes each color's value and opacity, and Show only from ... to hides the levels outside a range (for example only the cold tops). Sandwich lays a second picture over the first (infrared over visible is the classic) with its own colors, strength and a blend mode: normal, multiply, screen, darken, lighten, overlay, add or difference. Smoothing softens any picture (0 keeps every pixel), and a visible picture can Remove the background so only its bright, gray clouds show. With 3D clouds on and the map tilted, the Real 3D look (the default) raises the picture as one solid surface with a corner at about every pixel, each at its cloud top: Sharp keeps every pixel its own peak, like a satellite 3D loop, and Rounded turns the tops into domes (Roundness sets how much). Height sets how tall the clouds stand; Detail, the lowest top raised, brightness and the light direction are its own. Flat picture on the ground underneath (next to Lowest cloud top raised) fills what is not raised with the flat picture, so the gaps below the lowest top show the satellite picture instead of the map. It plays with the loop, on the flat map and the globe. The satellite loop plays every picture inside the play bar's loop length. The Columns look stands every cloud to its top (from the infrared picture, about 6.5 C colder per km, so colder is higher; the ground and warm low cloud stay flat) in the picture's own colors: Blocks or Smooth, with the column size, the lowest top shown, brightness, light direction, ambient and diffuse light, walls darker toward the ground, lines between the columns and shadows, on the flat map or the globe. Real clouds draws a volume lit by the sun, and Surface the picture raised to the tops. Heights are an estimate. Polar orbiters (JPSS hemisphere mosaics) are drawn as a globe seen from above the pole. An Ocean layer can sit above or below any picture.
21.2 Forecast models
The Forecast Models category of + Add product draws the weather models on the same map, with the same color tables, legend, header and loop. Choose a model: the HRRR (3 km, new every hour), the RAP, the REFS ensemble (its mean and its probability-matched mean), NAM Nest, NAM (12 km), the GFS, the National Blend of Models, the GEFS mean, NOAA’s AIGFS, the ECMWF IFS and AIFS (open data), the GFS wave model and Google DeepMind’s WeatherNext 3. Each one lists every field its newest run publishes that is a weather map, grouped as temperature, moisture, wind (including winds aloft), pressure and heights, precipitation, snow and ice, clouds and visibility, simulated radar and satellite, storm ingredients (CAPE, helicity, updraft helicity, shear), fire weather and smoke, sun and ground, and the blended forecast's percentile estimates and chances.
WeatherNext 3 (in the AI models) is Google DeepMind’s AI ensemble for the whole world, with a run every hour: the 00, 06, 12 and 18 UTC runs reach 15 days and the others 2 days. A run is ready about 7½ hours after its time. For each field it has the ensemble’s mean and the low end, lower side, middle, upper side and high end (the 10th, 25th, 50th, 75th and 90th percentiles). It comes on its own 10 km grid, and the fields are temperature, dew point, wind at 10 and 100 m, sea-level pressure, the last hour’s rain, total, low, middle and high cloud, sunshine and direct sunlight, and the sea surface temperature. Temperature and dew point also come tuned to weather stations at 5 km, and the rain also comes tuned to satellite rain (IMERG) and as an experimental rain. It needs no account of your own: AtmoDeck reads it for your license through its own server. It is an experimental forecast, not an official warning. The data is Google DeepMind’s, under its Real-Time Weather Forecasting Experimental Data Terms (past runs are CC BY 4.0), and the model’s card says so.
More detail
WeatherNext 3 steps every hour to the end of the run. Its rain also comes added up over the last 3, 6, 12 and 24 hours and since the run began (from the ensemble’s mean). AtmoDeck works out its relative humidity, feels-like temperature (heat index or wind chill) and an estimated cloud base from its temperature, dew point and wind. Under The same field, compared, a field with percentiles also has the Spread of the ensemble (from the 10th to the 90th percentile) and the chance of going over a value you type. That chance is read off the five percentiles, so it is an estimate, not a count of members. The lists come from what the run actually contains, and only the one field a picture needs is downloaded.
Model run: the newest run (its later hours are added as they come out), the newest full run (every hour already out), or any of the last ten runs (for example Run of 00Z Oct 7). The run you pick is used for every model layer on the map: the main one, the added ones and the hurricane model under a storm. The same choice is at the top of every model layer’s settings in Active layers, with Latest run and Latest full run first, next to Model, which switches that layer to the same field from another model (only the models that have the field are listed). The loop starts with the hour that is now and runs ahead as far as the play bar's Window says, out to 16 days for the models that reach that far (section 18.10); the header says FORECAST and the time in words.
Pick the same field in another model with one click to compare them. The picker opened here lists the models only.
Now, then the forecast. With a national map of now that a model also forecasts (the radar, or the RTMA temperature, dew point, humidity, wind, visibility or cloud), a Window that has both the past and the future carries the loop from the newest picture into the model's forecast of the same field (the radar into its simulated radar). The header names the model part (for example "HRRR simulated radar"). A Window that is all forecast shows the model alone.
The same colors. A model's field uses the color table and floor you gave the matching map of now (the national radar, the RTMA temperature ...) unless it has one of its own, so the loop does not change colors when it goes into the forecast.
Smooth model maps. The Smooth button on the tool rail blends a model's cells into a smooth field. A model's simulated radar, VIL, rain rate and clouds glide from hour to hour along the storms.
Narrated futurecast. Turn it on and the forecast steps through stops (now, then every few hours) instead of looping: it stays on each for a few seconds, the pictures blend from one stop to the next, and the header says the time in words ("Tonight 9 PM"). Save the map as a slide and it plays as that slide.
AtmoDeck's environment indexes. Three products worked out from several fields of the HRRR and NAM: a tornado environment index (instability, low-level helicity, deep-layer wind shear and a cap that is not too strong, multiplied, in the style of the significant tornado parameter), a supercell environment index and a large hail environment index (instability, shear and the height of the freezing level). About 1 is a setup where that kind of storm is possible; several is a setup forecasters watch closely. They show where the ingredients meet; they are not a forecast of a storm.
Severe weather maps. Under storm ingredients, every model that has the fields offers the 0 to 1 km and 0 to 3 km energy-helicity index, the 0 to 3 km and 700 to 500 mb lapse rates (the 0 to 3 km one also only where the surface CAPE is over 500 J/kg), and an estimated cloud base from the dew point spread for the models that give none of their own. Updraft helicity (2 to 5 km) also comes as the strongest of the last 3 hours and the strongest since the run began: the storm tracks of a whole run on one map.
Product, in a model layer’s settings in Active layers, lists every field of that model, grouped as in the menu: pick another one there without going back to + Add product. Storm tracks (updraft helicity over 75), under storm ingredients for the HRRR and the other models with 2 to 5 km updraft helicity, shades where a rotating storm passed in the hour a see-through black with a black outline. Picked from the list, it goes over the same model’s simulated reflectivity, which becomes the main layer; the Storm tracks box on a reflectivity layer adds the same layer. The legend shows it as one chip, Rotating storm passed. It is an ordinary layer of its own, so it can be restyled or taken off.
Not included: other countries’ own models (the Canadian, German and British models), which use file formats the map cannot read yet. The hurricane models HAFS-A and HAFS-B come with each storm (section 22.1).
Wind energy and contrails. Under Wind, Wind power density at 80 m is the power the wind carries through each square meter at a turbine’s hub height (about 200 W/m² is a fair wind resource, 400 good, 600 or more excellent), and Wind turbine output at 80 m (generic turbine) is what a typical utility turbine would make as a share of its rated power: it starts at 3 m/s, reaches full power at 12 m/s and shuts down above 25 m/s. It is the shape of a typical power curve, not one maker’s turbine. Under Upper air, Contrails, 300 to 200 mb (cruising altitude) shows where a jet would leave a short-lived or a lasting contrail. Every model that has the fields offers them.
Snow ratio (National Blend of Models, under Snow and ice) is how many inches of snow an inch of melted precipitation would make: about 10 to 1 is typical, wet, heavy snow is lower and fluffy snow higher. Like the Blend’s other fields, it has its low, middle and high-end versions.
21.3 A model in 3D, and its wind streams
A model in 3D. With the HRRR or the GFS as the main product, the 3D switch stands the forecast up: 3D: the forecast standing up draws the model's cloud water, ice, snow, rain and graupel at every pressure level, round the middle of the map, and fades it out at its edge. Show chooses The clouds or What a radar would see (the reflectivity of its rain, snow and graupel), and Look chooses Automatic (clouds as clouds, reflectivity in colors), Real clouds or The color table. The first time, the volume takes about 30 to 100 MB to build.
Wind streams in 3D (Wind streams in 3D, in the same menu) traces the model's wind at every level as streamlines round its clouds, drawn as light moving along them and colored by the speed.
21.4 A model compared with itself: change, spread and chance
With a model field on the map, its options offer the same field looked at three more ways. Each is a product of its own, so it plays, has its colors and legend, and can be saved like any other.
Change since the run before (or two runs before): this run's forecast for an hour minus the earlier run's forecast for the same hour, red where there is more and blue where there is less. It shows at a glance where the model changed its mind.
Spread (the National Blend of Models): how far the members of the blend are apart, so where the forecast is firm and where it could go several ways.
Chance of going over a value (the National Blend of Models): type the value (a gust of 50 mph, 90 degrees) and the map shows the chance of passing it, worked out from the blend's forecast and the spread of its members.
To see another run beside this one, use two panels with the Model run left out of what they share (section 23.15).
21.5 Daily highs and lows, day by day
The National Blend of Models' daily high and daily low temperatures are one picture per day for the week ahead: today, tomorrow and each day after it, as far as the newest runs reach. Each day is built from the hours the runs have actually published.
The map opens on Today and stays on the day you pick; the play bar steps through the days. The header is laid out like the radar's: FORECAST HIGHS or FORECAST LOWS as the title with the product under it, the day (TODAY, TOMORROW, TUE ...) where the clock goes, and the date and the model run under it.
Every model with a daily high or low (the Blend, the GFS, the ECMWF and the others) has a Day list in its layer’s settings in Active layers: Every day (the week) plays the week as a loop, or pick Today, Tomorrow or a day of the week ahead. The day is counted from today, so a scene, show block or still saved on Tomorrow shows tomorrow’s highs whenever it is played. Set the Day before saving a graphic of one day: the place of the play bar is not saved. If the model’s runs do not reach that day yet, the layer says so instead of showing another day. The measured highs and lows (RTMA) have their own Day list.
21.6 SHERBE and the Craven-Brooks parameter
The models have two more composite maps, for every model that carries the fields they need. SHERBE (severe hazards in environments with reduced buoyancy) is drawn from 0 up, with 1 the line of a significant severe environment. The Craven-Brooks significant severe parameter (mixed-layer CAPE times 0-6 km shear) is drawn in thousands of m³/s³, 20 and over being significant. Each has a legend whose labels are the real values with a word for what they mean. The supercell composite uses its published effective-layer scale (0 to 40).
21.7 Mesoanalysis
Current Mesoanalysis in + Add product and the right-click menu (section 18.13) both choose from 45 maps in six groups, worked out by the app itself from the HRRR model's hourly analysis. They are not pictures from another site: each is an ordinary model layer that you restyle in its own layer settings (color table, contour lines, readings, opacity, legend), and one is on the map at a time.
Group
Maps
Instability (10)
Surface-based, mixed-layer and most-unstable CAPE; low-level CAPE (0 to 3 km); the three CINs; lifted index; lapse rate, 700 to 500 mb; precipitable water
Levels (6)
The condensation level (LCL height), level of free convection, equilibrium level, the freezing level and the -10 C and -20 C levels (hail growth)
Wind shear and helicity (5)
Bulk shear 0 to 1 km and 0 to 6 km, storm-relative helicity 0 to 1 km and 0 to 3 km, storm motion
Severe-weather composites (8)
The significant tornado parameter, the supercell composite, the energy-helicity index, the significant severe parameter, the large hail environment, updraft helicity and hail size (the strongest in the last hour), and simulated radar
They show where the ingredients meet. They are not a forecast of a storm and not a warning. They depend on what the HRRR run currently offers.
21.8 Surface fronts, highs and lows
Surface fronts, highs and lows (WPC), a map overlay in + Add product, draws the Weather Prediction Center's surface map on the live map: cold, warm, stationary and occluded fronts with their pips, troughs, drylines, and the highs and lows with their pressure.
Show: The newest analysis (made every three hours), or The analysis and the forecasts to 48 hours, as a loop, which moves the fronts smoothly from one map to the next.
The time of each map puts its valid time on the map.
The fronts are drawn by the Forecast Builder (section 24.1) in its look: its colors, flat or 3D, its glow and shadow. Change them in the builder's Style menu. While the builder is open in the Console, or on the Output, its own map takes the place of this layer.
With the map's timeline (Show) draws the fronts, highs and lows for the time the header shows: blended between the Weather Prediction Center's maps and held at the first and the last. A future radar then plays with the fronts of each of its hours, the way a station's futurecast does.
Wind profilers (NOAA). In Add products (search wind profilers, under Conditions & Observations), the wind profilers still reporting (on the West Coast, in Idaho and at Table Mountain) each show the wind they measure at the height you choose above the ground, as a barb colored by its speed. Click one for its winds now and a chart of its last 12 hours by height.
21.9 The Space Weather page
The Space Weather page (Weather in the side bar, Full edition only) holds everything about the Sun, the solar wind and the sky above the Earth. Along the top are the NOAA scales now (R for radio blackouts, S for solar radiation storms, G for geomagnetic storms), the Kp index, the solar wind speed, Bz (turned south, storms are likelier) and the X-rays. All of it comes from the Space Weather Prediction Center and is read again every few minutes while the page is open. Click any of them for its card, large, with its chart.
Five views, each with a card for whatever is clicked. Over each is a header with what is shown, its time and where it comes from, its legend, the Powered by AtmoDeck badge and Export, which saves the view with its header in Pictures\AtmoDeck as a photo (PNG), a video (MP4) or a GIF: the map played through its timeline, the solar system through a year, the Sun and the Earth turned round (the Moon and Helioviewer’s flat pictures save as a photo). For a video or a GIF the menu has Map Studio’s options: the format, where it starts and stops on the view’s own timeline (or how far the Sun or the Earth turns), the speed, how many times it plays (a GIF can play for ever) and how long the last picture is held, with how many pictures and seconds that makes. No button or × is in what is saved.
Solar system: the Sun, the planets and the Moon where they are today, with the asteroids, comets and dwarf planets from JPL’s Small-Body Database (Ceres, Pluto, Vesta, Bennu, Halley, 3I/ATLAS and others, and the asteroids passing nearest the Earth in the next 60 days), and the comets near the Sun now, the eight brightest drawn with their tails. Drag to turn, scroll to zoom, press play to run time on. Zoom to or a double-click centres a body and zooms in on it; its card has Zoom to it and Back to the whole system. The search box finds a planet or anything in JPL’s database by name, number or designation (Vesta, 433, Halley, 2024 YR4); when several match they are listed to pick from, and a body found is kept in the view under Found by search.
Sun: the newest GOES SUVI picture on a globe, with the numbered sunspot regions and their flare chances and the C, M and X flares of the past week. Picture on the globe picks the wavelength, or one of Helioviewer’s pictures (ESA/NASA), shown flat: SDO’s AIA 131, 171, 193 and 304 Å and HMI magnetogram and visible light, SOHO’s LASCO C3 corona, and STEREO-A’s EUVI 195 Å and COR2 corona (seen from STEREO-A, ahead of the Earth in its orbit, and often a few days old).
Earth: a live satellite picture of the whole world, the GeoColor full disks of GOES-19, GOES-18, Himawari, Meteosat-12 and Meteosat-9 (CIRA SLIDER) laid together, over NASA’s Blue Marble (which fills the poles), with city lights at night, the aurora, the comets near the Sun (each where it is overhead, its tail away from the Sun), HF absorption, the view line, the GOES satellites and the points under the Sun and the Moon. Each can be turned off; the pictures are fetched again every ten minutes.
Moon: NASA’s picture of the Moon for the hour (Dial-a-Moon), its phase, how much is lit, its distance and size, the next new, first quarter, full and last quarter (from the US Naval Observatory), its next nearest and farthest, and a calendar of the month’s phases; step through the days and hours, and turn it south up for the southern sky.
Map: the weather map with only space weather on it. Map Studio’s toolbar, tool rail and play bar are put away, and the Space layers panel on the right, like Map Studio’s Active layers, has Flat or Globe and a row for each layer in the list: its eye shows or hides it, × takes it off the list and its name opens its settings (⚙ opens them all). + Add a layer lists the rest, and Product list has them in the product list. The layers: Aurora forecast (OVATION, the chance of the aurora overhead in the next half hour), HF radio absorption (D-RAP), Ionosphere (GloTEC total electron content), the models WAM-IPE ionosphere, WAM-IPE thermosphere and Geospace (the magnetic disturbance on the ground), Magnetometers (the USGS observatories, each colored by how far the horizontal field is from its day’s middle, or how fast it is changing), Geoelectric field, Day and night, GOES satellites, Sun and Moon and ICAO advisories. Under the map is a play bar like Map Studio’s: over it, whether the map shows Now (kept up to date), the Past or a Forecast, the layers and the time; then go to the start, ten minutes back, play, ten minutes on and go to the end, the timeline (the past shaded, the forecast in amber, a line at now) and Now; and under them the speed (10 minutes to 3 hours a second) and Repeat. It reaches back a day and ahead as far as a forecast that is on goes (WAM-IPE’s, the Kp forecast for the view line, a day for day and night); the layers that are only ever the latest (the aurora forecast, HF absorption and ICAO advisories) are named under it. Back in Map Studio, everything is as it was.
The side has four tabs: Now (a card for every reading, among them the Dst index from Kyoto and GFZ Potsdam’s Hp30, the Kp scale every half hour), Pictures (the SWPC’s images and movies), Text (the forecasts and reports) and Alerts (warnings, watches, alerts and summaries).
The large viewer and export
Click a card in Now, a picture, a text or an alert (or ⤢) to open it large, with a header and the Powered by AtmoDeck badge; a picture keeps its play, speed and frame slider, and scrolling zooms. Export saves it in Pictures\AtmoDeck as a photo (PNG), and an animated picture also as a video (MP4) or a GIF of every frame.
On the Output. Space Weather has the same Send to output, Explore / Live and Output on / off buttons in its top bar as the Weather Map; the Output shows the page full screen until the map is sent or turned on again.
21.10 The Earth & Quakes page
The Earth & Quakes page (in the Weather group, under Space Weather; Full AtmoDeck only) follows earthquakes, volcanoes and tsunamis on a map of their own. Its globe is the same one as the weather map’s: drag to move it, right-drag or Ctrl+drag to tilt and turn it, the wheel or a double-click to zoom, and the compass and the + and − buttons.
Four views.Globe (the whole Earth, the quakes at their depth over the plates), Block (a block of ground cut out under a place), Section (a cross-section through the quakes either side of a line) and Seismogram (a seismograph station, live, or after the chosen quake).
The side tabs.Quakes, Volcanoes, Tsunami & DART (bulletins, alerts, the travel-time estimate and the DART buoys) and Stations (the seismographs nearest the chosen quake).
Choose a quake and it fills the header and every export, with its P and S waves, its ShakeMap shaking and an estimated tsunami travel time. The travel time is an estimate of when a wave could arrive, not a forecast, and says nothing about its height. Esc lets the quake go.
A quake’s card has Details: its ShakeMap, Did You Feel It?, PAGER and the USGS aftershock forecast.
Right-click the map for what is there (the place, the nearest active fault and plate boundary, the rock), a survey of the quakes within 100, 250 or 500 km, and the views from that spot (Section here, Block here, center, seismogram, copy).
Layers: each can be shown, hidden, formatted or removed. Info boxes can be dragged off their spot, with a dashed line back to it.
Export ▾ saves a photo, a video or a GIF; Flyover zooms in on the chosen quake and slowly circles it.
Where it comes from
Quakes come from the U.S. Geological Survey; a strong quake the USGS has not posted yet comes from GFZ GEOFON (marked GFZ) until it does. Active faults are from the GEM Global Active Faults database (CC BY-SA 4.0). Volcano alert levels are from the USGS Volcano Hazards Program, ash advisories from the Aviation Weather Center, tsunami bulletins from the two NOAA tsunami warning centers, and the tsunami, ash, volcano and earthquake alerts of the Weather Service are shown too. Seismograms are from the Global Seismographic Network (EarthScope).
The weather map has three of these as layers in + Add product: Geologic map (Macrostrat), Volcanoes and ash (USGS, AWC) and DART tsunami buoys (NOAA) (section 21.12).
On the Output. The top bar has Send to output, Explore / Live and Output on / off, as on the Weather Map. The Output shows the page full screen, with a quake’s card as the only box when one is open. Sending the map, or turning the map’s Output on, takes the page off the Output.
21.11 Fire, smoke and drought
+ Add product has three map overlays (Wildfires and fire detections, Wildfire smoke (NOAA HMS) and U.S. Drought Monitor), layers from public services, with no keys to enter. Each can be switched on by itself, has its own legend, and lies in the stack of layers like the others.
Wildfires. A dot for every wildfire burning now (from the National Interagency Fire Center): its color says how much is contained (red under 10%, orange to 50%, yellow to 90%, green above), its size how many acres. Fire perimeters draws the mapped outlines, Satellite heat detections adds the heat the satellites saw in the last day (NOAA, the brightest 2000), Fire names labels the dots, and Only fires of at least hides the small ones. Click a fire for its size, containment, county and the day it was found.
Wildfire smoke. The smoke outlined from the satellites by NOAA’s Hazard Mapping System: light, medium or heavy. It shows where smoke is in the sky, not what reaches the ground.
U.S. Drought Monitor. The map of the week, from D0 (abnormally dry) to D4 (exceptional drought), with the share of the country in each level; Show from hides the milder levels. It is made on Tuesdays and published on Thursdays.
They are read when switched on and again every ten minutes (the drought map every six hours). All three need an internet connection; none is stored in the setup.
21.12 Earthquakes and tsunami bulletins
Earthquakes (USGS), a map overlay in + Add product, puts the earthquakes of the world on the map, from the U.S. Geological Survey. There is no key to enter; it is read when switched on and again every two minutes (every five for a long window), and nothing is stored in the setup.
The earthquakes. A circle for each, sized by magnitude and colored by depth (red is shallow, purple is deep), by age or by magnitude. Choose the window (the last hour to 30 days), the smallest magnitude, and whether to show the whole world or only what the map shows (read again as the map moves). A long window shows the strongest first.
Labels you can read.Write the magnitude beside chooses which earthquakes get a label (magnitude 6 and up, 5, 4, 3, or every one), And the place adds where it was, and Label size makes all the words of the layer bigger or smaller (up to 3 times). The labels lie over the map’s own names so they can be read.
Rings. A white ring round the newest (the last hour), a ring in the color of the USGS PAGER alert (green, yellow, orange, red: the damage expected), and a blue ring on an earthquake the USGS says has a tsunami message.
ShakeMap. Lines of equal shaking (the Modified Mercalli scale, II to X) for the strongest recent earthquakes, up to three, from the magnitude you choose.
Tsunami bulletins. The messages of the two NOAA tsunami warning centers (Palmer, Alaska, for the United States and Canada; Honolulu, for the Pacific) are shown as a marker at the earthquake in the color of the threat (red warning, orange watch, yellow advisory, blue information), with the magnitude and the place, kept for three days. Click it for the center’s words. The warnings and watches the Weather Service issues for your coast are still in Warnings and watches.
Plates and faults. The boundaries of the tectonic plates, and, zoomed in over the United States, the active faults (USGS), colored by how fast they slip.
Click an earthquake for its card: magnitude, place, time, depth, how many people felt it, and the alert. Magnitudes and places can change as the USGS reviews them. The legend lists what is on.
More layers of the solid Earth.Geologic map (Macrostrat) colors the rock by its age, and a click on the map names the rock under it. Volcanoes and ash (USGS, AWC) marks each volcano by its alert level, with the ash advisories for aircraft. DART tsunami buoys (NOAA) marks the deep-ocean buoys, in another color when one is in event mode. The Earth & Quakes page shows all of them together (section 21.10).
21.13 Air quality and the UV index
Two map overlays in + Add product (Other Hazards and Forecast Products) show the air and the sun.
Air quality (AirNow): a dot for each of AirNow's reporting areas, in the EPA's colors (good, moderate, unhealthy for sensitive groups, unhealthy, very unhealthy, hazardous), with its AQI. Show picks This hour, Today's forecast or Tomorrow's forecast, and Show from hides the better categories. Click a dot for now, today and tomorrow, the pollutant behind each (the worst of ozone and particles is the area's AQI), and whether an air quality action day was called. A forecast sometimes gives only its category, with no number.
UV index forecast (NOAA and EPA): the UV index at solar noon (about 1 PM daylight time) for 58 cities, made by the Climate Prediction Center the afternoon before with the clouds forecast. At 3 or more, sunscreen; at 8 or more, unprotected skin can burn in 15 minutes.
Both are the official numbers: AirNow is the EPA with the state, local and tribal air agencies. Search AQI, ozone or UV in + Add product to find them.
21.14 Aviation hazards: SIGMETs, G-AIRMETs and pilot reports
Aviation hazards (SIGMETs, G-AIRMETs, pilot reports), a map overlay in + Add product (Other Hazards), shows what pilots are being warned of, from the Aviation Weather Center:
SIGMETs (solid outline): thunderstorms (convective SIGMETs), severe turbulence and icing, volcanic ash. A SIGMET is for every aircraft.
G-AIRMETs (dashed): turbulence high and low, icing, low clouds and visibility (IFR), mountains obscured, strong surface wind and low-level wind shear, for the current hour. They are for lighter aircraft.
Pilot reports of moderate or worse turbulence (orange) and icing (blue) from the last two hours, larger for stronger; an urgent report is red.
Click an area or a report for its text. The fill strength is its own setting. Searching SIGMET, pilot or turbulence in + Add product finds it.
21.15 Terrain
Terrain is a layer (Terrain, a map overlay in + Add product) with three parts, from the free AWS elevation tiles: shaded relief (five shading styles, light direction and height, strength, colors), colors by height (four color sets) and real 3D ground that rises and falls with the land, with the map, its names and its roads on it. Relief and colors by height show on the globe too; the 3D ground needs the flat map.
21.16 Globe, sky and night lights
In the Base map panel (Globe, sky and space, section 23.2), set the projection to Globe and zoom out to see the planet. With the atmosphere on, a glow surrounds the planet against a starfield. You can edit the colors of the sky, horizon, haze and space, the glow and the stars. Zoomed in, the globe opens out smoothly into the flat map (fully flat from about a state across, where the 3D radar stands up) and curls back into the globe as you zoom out; the national radar, one radar, the satellite, 3D clouds and cross sections go with it. When you zoom in far enough to see sky rather than space, the sky is blue in the day and dark at night, at the place the map is centered, with warm colors at dawn and dusk (The sky follows the sun). Tilt the map to see the horizon and the sky shows the real stars, clouds and the sun and moon (section 18.18). Night lights darken the night side and turn on city lights, with their own strength and brightness; the night follows the time on the timeline or the real time. The night, like the outlooks, sea temperature and the other layers that lie on the map, is drawn over the land and ocean and always under the radar and the satellite.
22. Warnings, outlooks and the tropics
Warnings and watches on the map, outlooks, tropical cyclones, and the map that turns to a new warning by itself.
22.1 Outlooks, warnings and the tropics
Warnings and watches (the Warnings and watches row of Active layers): tornado, severe thunderstorm and flood, warnings and watches switched separately, with Show only buttons. Two more switches add the rest of the Weather Service's alerts, both on at first: Hurricane, tropical storm and storm surge watches and warnings, and Every other alert (advisories and statements, heat, wind, fire weather, fog, coastal flood, marine and the others), each drawn in its own color, so every alert that is out is on the map; turn either off to leave that group out. Polygon warnings are drawn on the whole map; county-based watches and river flood warnings are drawn from the Weather Service's watch and warning map service, each watch outlined once round its whole area. Click one and its box comes up with its full text (section 18.16). With the legend's watches and warnings on, the legend lists the ones on the screen now, the most serious first. With Follow the loop on (the default), every past frame shows the warnings that were in effect at its time, each with the polygon it had then; the newest frame shows what is in effect now.
Outlook overlays (Alerts & Outlooks in + Add product): SPC convective outlooks and storm reports, WPC excessive rainfall, fire weather and dry thunderstorms, winter storm severity with snow and ice chances, and NWS HeatRisk. Each area is named once, at its middle, in your map font. How it looks switches the fill and the outline on or off each by itself, sets the fill opacity (up to 100%) and the outline width, strength and dashes, the name size, color and letters, and every level of the categorical, tornado, wind and hail outlooks listed with a color of your own and a tick to show or hide it, kept separately for each kind (Reset puts the outlook's color back). The CPC hazards outlook (Winter tab) has the same Fill and Outline switches, a fill opacity and an outline width.
Tropical (Tropical cyclones, a map overlay in + Add product): the cone, the forecast track with time and wind at each point, past track, watches and warnings that follow the coast along their whole length (they cross a short gap of water, an inlet or the mouth of a bay, in a straight line, and do not go round a whole bay), wind fields, arrival times, wind probabilities, peak storm surge, the potential storm surge flooding map, storm surge risk by hurricane category and the development areas. Choose the storm; every color, line and label is adjustable, and watches can be listed in the legend. The watches and warnings are drawn as the counties and zones the Weather Service issues them for, each in the color of its kind (the Hurricane Center’s coastal lines are an option, and are read from its own file), and the layer looks at the Hurricane Center every 30 seconds, so a new advisory, watch or warning is on the map within about a minute of being issued. The category number on a moving storm grows and shrinks with Marker size and is drawn in the font and weight you chose. The legend has no section for the storm itself (its icons and lines say what they mean); it keeps the watches and warnings, the surge, the wind field, the arrival times and the outlook. Cross section. The Cross section button on the tool rail works on the hurricane models when the map is not one radar: drag a line near a storm and a slice from the ground up through its hurricane model (HAFS-A or HAFS-B) appears in its own panel, for the wind, the simulated reflectivity, the temperature, the humidity, the vertical motion or the absolute vorticity. Drag an end (or the line) to move it; right-click the map clears it. If the map shows a hurricane model, that one is cut; otherwise the model of the storm nearest the line. The Section menu beside the button has what it shows, the model, a line through the storm’s center instead (it moves with the storm), the smoothing, the top and the size.
Warning and watch style. Warnings and watches each have a global style of their own (fill and outline on or off, opacity, width, edge color, glow) with a tweak for each alert type below. Outlines are always solid, and the glow goes with its outline. A watch is outlined once round its whole area, not county by county. Special weather statements can be drawn on the map too. The header text stays white: a light alert color such as the yellow of a tornado watch is dimmed until white words read on it.
One Outlooks layer. The Storm Prediction Center's outlooks and the flash-flood, fire-weather, winter and heat outlooks are all in one place, and each shows its whole scale (every level, with its name and color, whether or not today's areas reach it) in the settings and the legend. SPC outlooks draw the conditional intensity hatching: tornado and wind have levels 1 to 3 (dashed one way, solid the other way, both crossing) and hail has levels 1 and 2, each with its own color and a switch. The legend shows each level as a small box of its hatch in its color, as the SPC’s own legend does.
Storm reports appear at their time: each SPC storm report of the day keeps the moment it was made. On a picture before the newest, only the reports made by that picture's time are drawn, so each one appears as the loop reaches it; the newest picture shows them all. The storm reports layer's At their time box (on by itself) switches this off.
Viewer photos. Viewers can send you their weather photos, and the ones you approve go on the map. In Storm reports > Viewer photos (or the settings of the Viewer photos layer under Active layers, or On Air > Viewer photos), Make the link gives your station a web page with your logo, and its QR code; put the QR code on air with the QR code content widget (section 9.1). A viewer opens the page on a phone, picks a photo, and can add a name, a place and a caption; the phone’s location comes with it if they allow it. Each photo waits under Waiting until you click Approve or Reject. Approved photos stay in your station’s folder on the AtmoDeck server. On a team (section 26.6) it is the team’s folder: every member sees the same link, the photos waiting and the approved ones, live, and a view only member looks without changing anything. A photo nobody decides on is deleted after 14 days.
The photo box, the link, and the photos on the map
Turn on Viewer photos on the map to pin the approved photos with a place as round pictures. Click one, or its Open button in the list, for its box: the same story box as an alert or a camera, with the photo, the sender and the caption. Drag it anywhere, drag its corner to make it bigger or smaller, and close it with its ×; the Output shows it too. In On Air, Full screen on air puts a photo full screen on the Output. The layer chooses how far back to show (6 hours to a week, or any time), the label and the size. A photo sent with no place has Pin here, which pins it at the center of the map; Hide pin takes one off the map and × deletes it from the server (for the whole team). Close stops the page taking photos until you Open it again, New link replaces the link (the old one stops working and its waiting photos go; the approved ones stay), and Delete removes the link and every photo on the server. This computer keeps a copy of the approved photos, so the map still has them when the server cannot be reached. Viewer photos need an AtmoDeck account; each address can send 12 photos an hour, up to 5 MB each.
The link is on photos.atmodeck.com. Save QR code saves the QR code as a picture, for a website or print. Post picture (square) and Story picture (tall, for stories) save a ready-made social media picture asking viewers for their photos, with your logo, your colors and the QR code. To use your own web address instead, open Your own address: Copy embed code gives the code that puts the page on your website; put it on a page there, give that page’s address (starting with https://) and click Save. The QR code, the pictures and Copy link then use your address; Use AtmoDeck’s goes back to the photos.atmodeck.com link. New link keeps your own address.
22.2 Potential tropical cyclones
Potential tropical cyclones are disturbances the Hurricane Center writes advisories for (with a cone, a track and watches or warnings) before they are a depression or a storm, because they could bring tropical-storm or hurricane conditions to land within 48 hours. The tropical layer draws them like a storm, with their own P symbol in a color of their own (set with the strength colors), and names them as such on the map and in the header when one is chosen. A forecast point keeps the P while the Hurricane Center still calls it one, and the color of the strength it is forecast to have after that.
Potential tropical cyclones, under Watching in the tropical menu, shows or hides them.
22.3 Hurricane model tracks (the spaghetti plot)
Hurricane model tracks, a map overlay in + Add product, draws one line for every forecast model the National Hurricane Center has a track for: its own official forecast, the consensus models, the global models, the hurricane models (HAFS-A, HAFS-B and the others), the ensemble means and members, and the AI models. Each line starts at the storm's place now and has the model's name at its end; the observed track so far is under them.
Storm and Model run choose which storm and which run.
Color lines by: a color for each model, one for each kind of model, or the wind the model gives the storm.
Show out to sets how many hours of each track are drawn, and A dot every 24 hours marks the days.
Early versions uses the tracks adjusted in time to now, as the Hurricane Center plots them.
The names, the observed track, the line size and the opacity each have their own setting.
Click a line for its card. Many lines close together mean the models agree; a wide spread means the track is uncertain. The official forecast and its cone are in the Tropical cyclones overlay (section 22.1), and the hurricane hunters are in Aircraft recon (section 22.11).
22.4 Clicking and filtering alerts
How the alerts on the map behave when you click them.
A watch, or any alert of many counties, is one alert. Click it and the whole of it is outlined and filled together (a tornado watch or a severe thunderstorm watch with all of its counties), and its box (or the header, with Show a clicked warning in the header on) reads out the alert as a whole, not the county you happened to click.
When the header shows a clicked warning, its details replace the legend. A click brings up the warning’s box on the map unless Show a clicked warning in the header is on (section 18.16). With it on, in the header settings, A clicked warning’s details chooses where they go: In place of the legend (the default; the legend comes back when the alert is let go, also when the legend is inside the header), Under the header, or Out the right side of the header’s top bar.
Show only this alert. Right-click an alert on the map and choose Show only this alert: every other warning and watch is hidden. Right-click again and choose Show all alerts again. It works for warnings, watches and every other kind of alert.
Alerts lie under the 3D radar. With the 3D radar or other 3D data on, the alerts are drawn under it, not over it.
More detail
Warnings and watches on the map are set the same way in the Alerts box's Map settings and in the Warnings row of Layers. There are four quick choices (Tornado · Severe · Flood, Warnings only, Watches only, Everything; the one that matches the switches is lit), a warnings / watches grid for tornado, severe thunderstorm and flood, the other kinds in two short columns and the legend switch. Look, Alert boxes and Automatic view are folded below. Tornado · Severe · Flood turns on exactly those three, their warnings and their watches, and the rest off. The choices only set the switches that were always there, so saved settings load as they were.
A kind switched off leaves the map at once, on the Console and the Output (a warning the feed misses for a moment is still kept briefly, but never one you have switched off). Flood and flash flood go together on every frame of a loop; the grid's row is called Flood & flash flood.
The public-safety products of the Weather Service's alerts feed are on the map under Other warnings: civil emergency, civil danger, evacuation, shelter in place, law enforcement, AMBER, blue alert, hazmat, nuclear and radiological warnings, and the others of the kind. A product that has no polygon is drawn as the zones it names.
22.5 The short line of a warning
The compact box of a clicked warning (section 18.16), and its details under the header (section 22.4), have room for a line or two. The text of a warning usually opens by repeating what the box already shows (its name, its area, how long it lasts), so AtmoDeck writes the line from the sentence that carries the numbers: wind and gusts, hail size, snow and ice amounts, rain and flood depth, visibility, heat index and wind chill, waves.
Sentences that only repeat the warning's name, area or times are left out, "miles per hour" is written mph, and the time a storm was seen is dropped because the box has its own clock. A warning with no numbers shows its hazard line, or its first sentence that says something. The line always ends on a whole word.
22.6 People inside a warning
Select a warning on the map and its panel says about how many people live inside it, for example ABOUT 170,000 PEOPLE. The count is made on the computer from the 2020 Census (every block group in the United States and Puerto Rico), so it needs no internet. A block group is counted when its centre is inside the warning, so the figure is an estimate to two figures; a warning over open country may include none, and then says nothing. A warning drawn by whole zones, with no polygon, is not counted.
22.7 Canada’s thunderstorm outlooks and alerts
With the Storm Prediction Center's day 1, 2 or 3 categorical outlook on the map (section 22.1), the areas of Canada's thunderstorm outlooks that are valid that day are drawn in the same layer. They come from Environment and Climate Change Canada's storm prediction centres (an experimental product, issued from May to October) and keep Environment Canada's own colors: minor in grey, moderate in yellow, high in orange and extreme in red. The legend names them as Canada's, and says when an area carries a tornado risk.
Whenever the view reaches into Canada, Canadian alerts of every kind are shown with the National Weather Service's, not only when the map is centred on Canada.
22.8 A gauge story
A river gauge is told as a graphic. Click a gauge (the river gauges layer) and its story comes up on the map, and on the Output (section 18.16), with:
the gauge and its river as the headline, and under it what the river is doing: the forecast crest and the flooding it brings, or the stage now when the river is only falling or has no forecast;
the flood categories (action, minor, moderate, major) as a key with their stages;
a callout for a flood watch or warning that covers the gauge, the most serious first, saying when it starts or until when it lasts and how many people are in it;
the hydrograph, large, with the flood categories as colored bands, what was measured, the forecast, its crest and a line at now;
a line from the panel to the gauge on the map.
The stage now is there at once; the crest and the hydrograph are filled in when the gauge's readings arrive. To keep a gauge's story on the map (saved with the map, in a scene or a block, its readings asked for again every ten minutes), open Raw data and choose Keep the story on the map (until it is taken off); the × at that panel's corner takes it off.
22.9 Water and flooding: rivers, rain reports, surge, tides and road risk
The water and flooding layers are map overlays in + Add product. Each is switched on by itself and has its settings in its row of Active layers.
River gauges: a dot for each National Weather Service gauge, colored by flood category (what is observed, the highest in the forecast, or whichever is worse), with the stage beside it. Click one for its story (section 22.8).
CoCoRaHS rain reports: the volunteers' rain and snow measurements of the day, the amount beside a dot colored by how much fell. Click one for the report.
Rain totals and flood guidance: Stage IV rain totals, the River Forecast Centers' flash flood guidance and the National Water Model's forecasts, drawn under the radar like the other ground layers.
Storm surge and tide gauges: NOAA's tide gauges with the water level now, colored by the flood level reached, and the level (with the surge in brackets) beside each. Surge forecast picture (STOFS) lays NOAA's surge and tide forecast over the coast for the hour you choose: STOFS-3D for the Atlantic or the Pacific shows the water and where it floods the land, and the global STOFS-2D the highest water level of the run.
Roadway flood and hydroplaning risk: the roads on screen colored by where the rain will put water on them (water may stand, likely to flood, dangerous, severe) or where a tire will float (wet, hydroplaning possible, likely, severe). It is worked out on your computer from the radar's rain rate and the rain of the last hour against a terrain model: how much ground drains to each low spot and how deep it fills. Choose which risk to show, the lowest level drawn, colored roads or a heat map over the ground, the line size and the opacity. Click a road for the reading there.
More detail
The road risk is an estimate for the situation as a whole, made from radar and a terrain model. It is not a measurement of any street, and not a road closure: say "roads in this part of town are likely to flood", not "this street is flooded".
The snow layers (snowfall and snow depth from NOHRSC, snow and ice cover, snow and ice reports, SNOTEL stations), buoys, ship reports and sea surface temperature are map overlays in the same list.
Ice accumulation. The Ice accumulation product shows the ice that freezing rain builds up on trees, power lines and roads over each place’s own day: the Weather Service’s 6-hour ice forecasts added up. Pick the day in the layer, from the rest of today to three days on; it is a forecast only. The Ice for the day chip under Winter puts it on, beside the 6-hour ice forecast. A quarter inch brings down limbs and power lines.
Ocean currents. The Ocean currents layer shows the sea’s surface currents from NOAA’s global ocean model, with its own opacity and legend.
22.10 Snow and ice chances (WPC)
The Winter menu’s Snow and ice chances (WPC) shows the Weather Prediction Center’s probabilistic winter forecast for the next three days, in WPC’s own colors.
Of: snow or freezing rain. Show: the chance of at least an amount, or the amount itself at a percentile.
Over: 12, 24, 48 or 72 hours. Ending: when that period ends, every 6 hours out to three days.
At least (chances): 1 to 30 inches of snow, or 0.01 to 1 inch of ice. A period that lacks the amount uses the nearest one below it.
Amount (amounts): the 5th percentile is the low end, the 50th the middle, the 95th the high end.
Click an area for its range, the chance of more than that amount, and the times it covers. WPC issues the forecast twice a day; the map checks for a new one every half hour.
22.11 Hurricane hunters: mission extremes
With the aircraft reconnaissance layer on (the hurricane hunters of the Air Force and NOAA), its settings list the mission extremes of the newest flights: the storm, the aircraft, the hours it flew and how many observations it sent, then what it found, each with the time:
the lowest center pressure of the fixes made during the flight, and the lowest surface pressure along its track;
the strongest flight-level wind and the strongest surface wind, in knots and mph;
the heaviest rain.
Mission extremes card on the map puts the newest flight's extremes in a card at the lower left of the map, in the look of the other cards, on the Output too. Training and test flights are left out.
22.12 The automatic warning view
Set it up in the Warnings and watches row of Active layers: When a new warning goes out, take the map to it by itself, and back afterwards. When a new tornado, severe thunderstorm or flash flood warning goes out in your area (it names one of the counties you watch under Content; with none chosen, every warning counts), the Output map comes up on it by itself: fitted to the warning, on the radar nearest to it (its own scan; the national radar, or leaving the radar as it is, are the other choices), with the warning selected (it glows, its details take over the header, and it goes on the threat matrix, the alert strip and the ticker), even while a show is playing. With several warnings up it cycles, and when they end everything goes back as it was. While a show is playing, the warning takes the Output over, the show waits, and when the warning is over the same step starts again from its beginning (switch that choice off and the show is never interrupted). What was already up when AtmoDeck started is not treated as new, unless it went out in the last 15 minutes.
23. The look of the map: layers, custom data and the header
How the map is styled, the order and kinds of layers on it, your own data, and the header and legend that frame it on the Output.
23.1 The look of the map
Base map: Dark, Light, Bright streets, Liberty (detailed), Simulated satellite (fast: the ground drawn from the map’s own data, section 23.3) or Satellite (USGS). Color theme presets (Broadcast dark, Storm slate, Midnight blue, Clean light) set the base map and colors in one click; land, water, parks, roads, borders and buildings can be recolored.
Text (Base map > Place names and fonts, section 23.2): any Google Font, or one font for everything (section 23.5), chosen from a searchable list or typed, for cities and towns, streets, water and region names, and marker names, each with its own weight, size, color and outline. Boxes behind names have adjustable corner radius and padding. Three sliders set how many cities, towns and villages show.
Lines and details: road widths and outlines, state and country lines, county lines (US), interstate and highway shields, and Only my area, which dims everything outside your chosen counties and lifts them with an edge and a soft shadow.
Markers: up to 200 points (dot, square, diamond, triangle, star, pin) with a boxed name, added by clicking the map; drag one to move it.
Saved map styles. Under Color theme are the built-in themes and, under My styles, your own. Type a name and click Save style to keep the map's look as a style: the base map, its colors, the roads, borders, names and fonts, the ocean, the imagery and the grid. Saving with the same name saves over it, and the cross beside the chosen style deletes it. A style changes only the look, not the products on the map. The Map appearance menu opens with the same Color theme picker.
A style for every block. A saved style shows under Color theme in every block as well. With a style chosen, All blocks puts it on every saved block: where each block looks and what it shows stay its own. Saving into a style again updates every block that uses it. What a block has changed from its style is listed under the picker (N changes from “style”), each with a button to go back to the style’s value, and Reset all to the style.
My styles. Under Save style, a row of buttons holds every saved style; one click puts it on the map, and the style in use is marked. Saved styles are also their own type in the Library (Map styles): Apply puts one on the map, All blocks puts it on every block, Update saves the current look under that name (blocks using it take it too), and Organize renames or deletes it.
23.2 The Base map panel, section by section
Map appearance > Base map and labels (or the Base map button of the tool rail) opens the Base map panel. Its sections sit in five tabs across the top: Style (Map style; Globe, sky and space; Mouse and cards), Ground (Ground, water and buildings; Rails, airfields, ferries and parks), Roads, Lines (Boundaries; Latitude and longitude lines) and Names (Place names and fonts). The panel remembers the tab you were on, and the find box opens the tab a setting is on.
Section
What is in it
Map style
The color theme, the map under the radar (Dark, Light, Bright streets, Liberty or Satellite) and 3D terrain in the preview.
Ground, water and buildings
Land, water, parks and forest, desert and building colors, buildings on or off, shaded relief, and on Liberty the green ground and the building opacity.
Place names and fonts
Names on or off, how many cities, towns and villages show, capitals, the one font for the whole map, the font and box of each kind of name, and on Liberty every kind of label with its own switch and look.
Roads and highway signs
Which roads show and whether they sit over the radar, road colors and widths, outlines, painted crossings and the route shields.
Boundaries
State and country lines, coastlines, when state lines appear, and the county lines and names.
Rails, airfields, ferries and parks
Rail lines, runways, ferry routes, piers, and park outlines (off unless you turn them on).
Latitude and longitude lines
The grid, its color and its labels.
Globe, sky and space
The globe, the sky, day and night.
Mouse and cards
The mouse wheel's zoom speed and the size of the cards that open on the map.
The panel stays where you scrolled it, and the sections you opened stay open, while you change settings. Buildings and the green ground are drawn as solid shapes with no outlines. The Console zooms in as far as the Output, down to street level.
23.3 The simulated satellite map
Simulated satellite (fast), in the list of base maps (Base map > Map style), is the ground as it looks from above without any imagery: it is drawn from the same map data as the Dark and Liberty maps, so it is there as fast as they are and needs no pictures downloaded.
The whole country is colored by Natural Earth's land-cover picture: forest green, plains, desert tan, ice, with the relief shaded in.
Zoomed in, the map's own shapes are drawn over it in the colors they have from above: forest, grass and meadow, farmland, parks, wetland, desert and sand, bare rock, ice, the built-up ground of every town, shops and industry, airports, lakes, rivers and buildings.
It is a drawing of the ground, not a photograph: where the map data has no land cover (wide farm country, for one), the ground is one even color.
Everything about it is under Base map (section 23.2) while it is the chosen map:
Ground, water and buildings: Saturation, Contrast, Brightness and Hue shift for the picture as a whole (the same four the satellite imagery has); Show buildings, Buildings in 3D (from zoom 14; tilt the map to see their height) and Houses too (every building, from Overture Maps: the map's own data has few houses in most American neighborhoods; off draws only the buildings OpenStreetMap has); and Colors of the ground, a color for each kind of ground listed above. Reset the picture and its colors puts all of it back.
Roads and highway signs: a color each for Interstates, Highways (US and state) and Streets and other roads, and the Road outline.
Place names and fonts: every kind of label, each with its own switch, color, size and outline, as on the Liberty map. Places of interest (parks, schools, hospitals, shops and other named buildings) and Airports start on; transit stops start off.
State, country and county lines and the coast take the colors set for the satellite map (Satellite imagery, in the same panel), so the two maps share one set.
23.4 Only my cities, only the interstates, and when lines and names show
The Place names and Roads cards of the Base map sidebar keep a busy map readable.
Only my cities’ names names just the cities in Content > Places until the map is zoomed in past the zoom you choose (4 to 24); from there in, every place is named again. It is its own switch, in the Place names card and in the Map menu, and works with or without the county spotlight. The card says whether only your cities are named at the zoom the map is at.
Only interstates leaves the interstates and hides the US and state highways, the streets and their signs. Each road card keeps its own settings for when it is turned off.
With Only interstates on, Only these interstates takes the route numbers to keep (80, 35): only those interstates are drawn, with their signs and numbers; blank keeps them all. Without signs, the route number along the road is set larger.
Rivers and streams, in the Water card of the Base map, turns the waterways off.
Every kind of line and of place name has a zoom range: the zoom it starts showing at and the zoom it stops at.
Place names can be given an exact size in points instead of a size relative to the map's own; marker names (the points you place) take their exact size too.
The zooms are the Output's. The strip at the top of the map (Find a place, Views, Scan) shows the zoom the map is at in the same numbers, so you can read off the zoom to type in.
Every place name is set alike: the smallest places (hamlets) are spaced like a city.
23.5 One font for the whole map
The Map font switch (first in the Map appearance menu, and in Place names and fonts) puts one font on everything on the map: the names, the header, the legend, the values above the cities, storm names and the map layers.
While it is on, every font setting below it shows that font, so what you see in the settings is what is drawn. Each section's own font is kept: turn the switch off and every section gets its own font back.
23.6 Values above the cities
The values a layer writes above the cities (its point readings) are kept off the names of the other places. Keep the values off other cities' names is on by default, in the readings settings of the main layer and of every data layer:
A value that would cover another city's name moves to the right of its own name, then to the left, then under it.
When there is no room anywhere, it stays above its name and the city behind it is taken off the map (its name, value and weather icon), so nothing is drawn on top of anything else. A place that is showing its own value is never taken off.
Turning the setting off, or turning the readings off, brings every hidden place back. Weather icons sit beside their value, or above the name when there is no value.
23.7 One number per county
One number per county (Map Studio, Point readings) gives each county of your area (Content > Counties) one value in its middle: the highest, the average or the lowest of the picture over the whole county, with its biggest town, the county's name or nothing under it. The towns' own names inside your area are taken off so the numbers have the room. With the spotlight on your area dimming the rest, it is a station's county rain-total or low-temperature map. Each county is read on a net of up to 400 spots and its number placed at the spot deepest inside it, once per picture.
23.8 The layers list: order, data layers and custom layers
Order. The top of the list is drawn on top. Drag a row (or use its arrows) to change what is drawn over what. A line divides the list into Drawn over the roads and street names, Drawn under the roads and names and Drawn under the ocean layer (just above the base map): drag a row across a line, or press the up arrow on the top row of one group or the down arrow on the bottom row of the one above, and the layer moves to the other group and stays there. The city names are over every layer, whatever the order, so a layer that must be over the roads but under the names goes in the first group. A layer under the roads is under them whatever Draw roads on top of the radar is set to (that setting only places the radar, the satellite and the data layers). The ocean layer is locked at the bottom of the second group. The header and legend, the warnings and watches, point readings, weather icons and lightning stay on top and the base map stays at the bottom; their rows are locked.
Each row has an eye (hide it and keep it listed), a legend button when the layer has a legend (one click hides that layer's legend, another shows it; a layer with several legends, like the tropical cyclones, hides them together), a cross (take it off the map) and a drop-down with all of its settings. A data layer's row keeps counting its frames as they arrive.
Add a data layer. Any national map or model field can be added as a layer over the radar and over each other: up to four, each on the map once, following the timeline. They are added with Add layer in + Add product (section 18.3). Every data layer has Fill, Line and Point tabs (the fill, a line along each color edge, and its value above the cities), and wind layers add Barbs and Particles (streaks that fill the screen at any zoom, move the way the wind blows and faster in a stronger wind). The Fill tab has a switch to turn the fill off and keep the lines, points, barbs and streaks, and shows the layer's own color table, floor and smoothing.
More than one base map. Add a second map under the radar: it is drawn over the first, and each map can be brought in whole, as its place names only, or as names and areas together.
Legends, in Map appearance, lists every legend on the map by layer with the same click, plus Show all, Hide all and the switch for the whole legend. A legend you hide stays hidden, even when its layer is turned off and on, until you show it again.
The map you have looked at is kept on the disk: the ground, roads and names and the satellite imagery are fetched once and drawn from the disk next time, so the map is there before the network answers. The satellite pictures of the United States, Canada and Mexico (zoom 0 to 8, about 7,400 tiles) are kept on disk in the background from the first start, so a tilted view that shows far away is already filled in. Keys & Backup > Backup & Restore shows, under Caches, how much the app holds (radar volumes and scans, model pictures, place names, the web engine cache; the tile cache holds up to 800 MB) and can empty it; nothing you have chosen is in there, and it downloads again as it is needed.
23.9 Custom layers
+ Add custom layer, at the top of Active layers, brings in your own data: GeoJSON, KML, KMZ, a shapefile (a zip, or the .shp with its .dbf and .prj) or a placefile, from a file on your computer or a web address. Each is a layer of its own over the roads and under the city names (up to 12), with the colors and widths the file asks for (and a color of your own where it does not), names, fill and opacity, and it can be moved, hidden or taken off like any other layer. A file is kept on disk for both windows.
Updates. A layer that comes from an address or from a file on this computer can be checked for updates as often as every 10 seconds, every 30 seconds, 1, 2, 5, 10, 15 or 30 minutes, every hour, 6 hours or every day (an address is downloaded again when it is due, a file is looked at and read again as soon as it changes; Update now does it by hand). The Console has to be open for the checks, and the Output follows.
Placefiles made of objects work, with their icon sheets, text beside each icon and hover words; click a place for its card. The Iowa Mesonet road weather feed and the Spotter Network positions both load.
Save to my layers keeps a layer's source and look to add again later, and a layer can put its name in the header with the others.
A map saved as a slide (section 13.16) remembers which custom layers were on and how each looked; their data stays the layer's own and keeps updating.
23.10 The header
While the map is on, two widgets belong to it: the header and the legend. They are positioned, resized and switched off like any other widget in Edit Mode (section 8.2). The list of arrival times is a box on the map itself, dragged on the preview (section 20.9).
The header stops where another widget begins on its right (the camera, a panel, the threat matrix), instead of running under it, and a title or a line of text that does not fit gets smaller until it fits on its one line (the title down to a third of its size) rather than going on to a second line. The header is an "upper third" bar with your logo, a title, the product name, a tagline, the frame time, its age, the date, loop information, a LIVE badge and a timeline strip. Each label can be switched off. The header is dressed in the shared look of the broadcast: its colors, finish, corners and edges, and the threat color while a warning is selected. Use the broadcast logo and font takes the station logo and the theme font; its shape and colors are in section 23.11. A warning takes over the title while it is active, LIVE shows on the newest frame, and the time and timeline follow the loop.
More detail
A warning takes over the header (What the header shows; on as it starts). Turn it off and a chosen warning or tropical storm leaves the header as it is, with its own title, colors and lines; the warning still shows on the map in its own box.
A right-click on the header types a title that is kept with the map as it is now (not the product's name or the header's title); a slide or block saved from it takes it as its own title. Every weather layer (AtmoCast, the SPC outlook and reports, water, winter, fire, air, space, earthquakes, storm intel and tropical) can be renamed under Rename a product and is named so in the header and its legend (with a block open, the new name is that block’s alone: every other block keeps the names it shows), and their legends follow Legend: show the product name and Legend: show the values.
Plain names in the header. By default every product layer's header title is its plain name (Temperature, High temperature, Wind speed, Visible), the time, day and date are in the time box, and where the picture comes from (RTMA analysis, NWS forecast (NDFD), HRRR, the satellite and its band) is in the line under the title. Under Header > Title and product names, Subtitle sits right under Header title: what you type there replaces the line under the title (the product's source, the other layers, the outlook, the radar site and the tagline). A warning's or a storm's line still comes in front of it. Leave it empty to get the automatic line back. It is kept with the map, up to 80 characters. Renaming a product, or typing a header title, still wins over the product's name.
Clock size (Header > Font, size and width, 50 to 150%) makes the header's time box smaller or larger: the time, its date line and the share of the header the box takes all change together, so a smaller clock leaves the title more room.
Time shows (What the header shows, under Frame time) chooses what the time box says: Automatic (the day on a forecast of days), The clock, or The day and date. On Automatic, a map whose range is the next 3 days or longer, or one map a day, shows the day (THURSDAY) and its date instead of the clock. Each block keeps its own choice.
23.11 The header’s shape: accent bar, time box and diagonal edges
The map header follows the shared look (Look > Colors: the finish, fill, corners and edges, and each part's colors). In Header (upper third):
Give the time its own box color: the box behind the time takes a color of its own (blue by default); its text turns black or white to stay readable.
Accent bar down the left side and along the bottom: one bar in an L, joined at the corner, in the theme's accent or a color you pick. It adds to the header's height, and the legend under it moves down with it.
Show a background behind the header logo, with its color.
With Diagonal edges, both ends of the header slant, and so do the edges between the logo, title and time boxes and the accent bar, all parallel. The legend and a clicked warning's box keep straight ends and meet the header's bottom corners with no gap.
Header and legend colors (with the start and end of each gradient and the text colors) are edited with Edit header and legend colors. A forecast field on its own is titled like the radar (FORECAST, FORECAST HIGHS, CURRENT CONDITIONS) with its name under the title. A joined radar picture names every radar in it, and the Powered by AtmoDeck box takes your accent color.
23.12 The header creator (your own picture)
Open Header and legend (on air) in Active layers, or Map appearance > Header and output appearance, and set Header style to My own picture: I place every element on it.
Upload a PNG. It becomes the background of the header, and the header takes the picture's shape.
Drag each element on the picture where you want it, or select it and use the arrow keys (hold Shift for bigger steps). Use Edit on a large picture for more room. Each element has its own size, color, weight and text, and Put every element back resets the placements.
Elements that have nothing to show stay hidden, and elements switched off under Labels shown stay off.
Very large pictures are shrunk when they are stored so they fit in your settings.
23.13 The legend
The color legend uses the table's own colors with nice tick values and a unit on every value. Choose per product whether values show as units, numbers only, another unit (mph, mm) or words: the words sit where their value is on the color bar (hail from pea to baseball, wind from light to extreme, rain from light to hail, velocity as across beam, with storm, and so on). The legend is as tall as its contents. It can be a separate widget or combined into the header, in either style of header.
23.14 Compare two maps side by side
Compare puts two national maps or model fields side by side on the same map, with a divider that swipes between them: the radar against the model's forecast, the HRRR against the NAM, the temperature now against tomorrow's. The main layer shows on the left of the divider and a data layer on the right.
Add the second map as a data layer, open its settings in Layers, and choose Compare with the main map. The main layer has to be a national map or a model, not a single radar.
The divider is drawn on the map, and the one in the Console can be dragged. It can also sweep from side to side by itself; set how many seconds a sweep takes.
Each side can be named on the map.
The timeline, the colors, the opacity and the legend work as they always do, and the Output shows exactly what the Console shows.
23.15 Panels and what they share
The 2, 3 and 4 buttons in the top bar split the map into panels: two side by side, one large map with two small ones, or four. Panel 1 is the main map itself, with every tool it has (the layers, drawing, reading, the right-click menu, soundings, 3D and Export), so it is there the moment you split. The other panels are made as the pointer comes to the buttons and are kept ready for a few minutes after you go back to one map, so switching between 1, 2, 3 and 4 is immediate.
Each panel has a header with what it shows (the site, product and tilt, the national radar, the satellite or the model, and the run or the archive window). A click on it opens Add product for that panel, and the cross on panels 2 to 4 empties it. Pick a panel and the Active layers list edits that panel's layers; what you set in panel 1 is set on the main map. A new panel 2, 3 or 4 is blank and loads nothing until you put a product on it, unless Product is shared.
The Sync between maps menu at the top of the layers chooses what the panels share:
Choice
What it does
View
Place, zoom, bearing and tilt. The maps move together as you drag, not after: drag any panel and the others follow it.
Product
The main map's product and layers in every panel.
Radar site
The same radar in every panel.
Model run
The same forecast run.
Time
The same moment, from the main play bar: each panel shows its picture nearest that time.
Forecast hour
The same forecast hour, for two runs or two models side by side.
Play together
When time is not shared, each panel's own loop starts and stops with the main one. On by itself.
Overlays
The main map's warnings, outlines and overlays in every panel.
Everything not shared belongs to each panel: a product, site or run you choose in a panel stays with it, and a panel you drag while View is not shared keeps its own place. There is one 3D and one cross section among the panels; the panel that turns one on takes it from the others. A panel's names and labels are drawn at the panel's own size, so the four maps read alike.
24. Forecast Builder: fronts, highs and lows
Forecast Builder is the second mode of Map Studio (full version): the weather-map graphics of a television forecast, drawn on the same map and played as a smooth animation. It is in Solo, Standard and Pro.
24.1 Keyframes, and the forecast placed for you
Click Forecast Builder beside Live Map. The tool rail becomes the pieces of a weather map, and the top bar gets the builder's own menus: Auto (WPC), Paint, Text, Style, Slide / video and Save block, then, under the heading Under it, the radar, models, satellite, map and view that lie beneath the forecast.
The builder works in keyframes. A keyframe is the map at one time. Between two keyframes every piece that is in both slides smoothly from one place to the other, and a piece that is in only one fades and grows in or out.
+ makes a new keyframe later on, starting as a copy of the one you are on: move the pieces to where they will be. − deletes the keyframe, and the time box sets its time. Length is how long the whole timeline takes to play.
Auto (WPC) does it for you: Place the WPC forecast on the map replaces the keyframes with the fronts, highs and lows the Weather Prediction Center has drawn, its newest surface analysis and its forecasts out to 48 hours, with the pieces matched from one to the next. Troughs, and highs and lows, can be left out.
Keep it up to date uses the newest WPC forecast every time the map is shown, on the Output or as a slide. Changing a piece turns that off and keeps your version.
The timeline needs two keyframes to play; with one, the forecast is a still map.
24.2 The pieces: fronts, pressure centers, the jet stream, labels and paint
Pick a piece on the tool rail and draw it on the map.
Lines: cold front, warm front, stationary front, occluded front, trough, dryline and squall line. Drag along the map. The pips go on the left of the way you draw, and Flip moves them to the other side.
High pressure and Low pressure: click to place.
Jet stream and Arrow: drag along the path; an arrow points where you finish.
Label and Text: click, type, Enter. The Text menu has the same text as the live map's (shine, shadow, outline, weight, alignment, up to three lines) and the text gallery.
Paint: drag to spray an area on the map, under the lines and over the land (the rain of tomorrow, a snow band, a risk area). The Paint menu has the color, the brush size, hard or faded edges, opacity, how it blends with the map, outlines round the painted areas, and whether the ocean covers the paint so that it stops at the coast. Each keyframe has its own paint, which fades to the next one's as the forecast plays. The paint eraser takes it away.
Select and move: drag a piece to move it. On the chosen line, drag a yellow point to reshape it, or a hollow one between two points to bend it there. A piece can be put, as it is, into every other keyframe so that it stays still through them.
Eraser removes a piece from this keyframe, Undo is Ctrl + Z, and Clear this keyframe empties it.
The pieces are kept as places on the earth, so a front's pips, a line's width and a letter's size stay the same on the screen at any zoom.
24.3 Flat or 3D, colors and motion
The Style menu chooses how the pieces look:
3D: solid pieces floating over the map, each with its shadow on the ground and the jet stream highest. Depth sets how high they float and how thick they are. Tilt the map to see it (right-drag, or Ctrl-drag, turns and tilts it by hand).
Flat: glossy, with a glow and a drop shadow.
Size, Glow and Shadow on the map.
Motion: arrows that turn round the highs (clockwise) and the lows (counterclockwise) with their speed, and a jet stream that flows as moving chevrons.
Time on the map: at the bottom, at the top or not shown, and a pause on each keyframe.
Colors for each kind of piece. A color chosen for one piece (click it with Select) stays its own.
24.4 On the Output: slides, videos and blocks
On output, and Show the forecast on the output map in the Slide / video menu, put the forecast on air over whatever lies under it.
Under it: the Radar, Models and Satellite menus choose what the forecast is drawn over (the radar loop, a model field, a satellite picture), and Map and View are the base map and the camera, as on the live map.
Save as a slide (Slide / video) names the forecast as a slide for the Show page. With one keyframe it is a still map.
Record video makes an MP4 of the timeline, of the whole output with its overlay or of the map only, at 30 frames a second, or 60 with Record smoother. It needs two keyframes or more.
Save block saves the forecast as a block for the Show page (section 13.1): the timeline played some laps, or the selected keyframe held as one picture, with the camera staying put, touring your viewpoints or following moves you record.
25. Archive mode: a radar of the past
Archive mode is a third mode of Map Studio, beside Live Map and Forecast Builder. It has its own radar, window, product, overlays and title, and nothing you set there changes the live radar map: leaving the mode puts the live map back exactly as it was. It uses only free public data and needs no key.
25.1 Opening it and choosing the time
In Map Studio click Archive in the first group of the toolbar (next to Live Map and Forecast Builder). The map flies to the radar chosen and the bar under the map gets the date and time chooser.
Window (the first menu of Archive mode's top bar, which goes on: the product, Overlays, Texts, Sounding, Events, Event title, Map, View, Save block, Export and Settings): the radar site, and the start and end of the window. A window is up to three days, any date back to 1991. A long window is played in parts of about three hours; Play on through the window carries on from one part to the next.
The bottom bar: From, To, Length and Load sit next to the Repeat button; the More settings sit next to Speed. Under the map a timeline shows where the loop is in the window.
Product: the radar product to play. Only products the chosen radar had on those dates are offered.
On output puts the archive on the Output, like the live map; leave it off to keep it in the Console as a preview.
Archive mode is not remembered across restarts on purpose: AtmoDeck always starts on the live map. Everything else you set in it is remembered.
25.2 The products of a window, and the 3D box
Product lists only what the chosen radar has for the window. When a radar or a window is chosen, AtmoDeck reads one scan from the middle of it and lists the products that scan carries; while it does, the note under the list says it is checking.
The dual-pol products (correlation coefficient, differential reflectivity and the others) reached each radar on its own day between 2011 and 2013, so the same date can have them at one radar and not at another.
The radar's own finished products (echo tops, VIL, hybrid scan, rain totals) are in the archive from the end of March 2020.
If the product that was chosen is not in the new window, the archive goes to reflectivity and a message says so.
The loop of an archive window is made of the archive's scans alone: the newest scan of the live map is not added to its end.
The 3D box. The tool rail has a box button beside 3D: draw a box on the archive's radar and the map zooms and tilts into that part, with 3D made only inside it, as on the live map (section 19.7). The box is the archive's own and does not change the live map's.
25.3 What can be drawn with it
The Overlays menu lists everything the archive holds, in groups. A choice that did not exist yet for the dates (a radar, a product, an overlay) is greyed out with the year it starts, so you can only pick what the archive has.
Overlay
What it shows
NWS alerts
The warnings as the Weather Service sent them, each drawn while it was in effect (tornado, severe thunderstorm, flash flood and the rest), with the same colors as the live map.
NWS watches
The Storm Prediction Center watch boxes in effect at each picture. As on the live map, they can be listed in the legend.
Mesoscale discussions
The SPC mesoscale discussions, outlined with their numbers.
Storm reports
The local storm reports (tornado, hail, wind and the rest), as round badges, from 2004.
NCEI Storm Events
The official event record: deaths, injuries, damage in dollars and the forecaster's narrative, on a click.
DAT damage
NOAA damage assessment toolkit surveys, with the rating found, from 2010.
DAT survey tracks
The line each Weather Service damage survey drew, drawn along that line as the loop reaches the tornado's start and end, its tip a dot, and named with its rating, deaths and injuries once it is over. The damage swaths, the areas by EF rating, show once the track has ended. From 2010.
Tornado tracks
The Storm Prediction Center's tornado record: each track grows from touchdown to lift, colored by rating and named when it is over.
Observations
Airport observations (ASOS) at that time.
River gauges
USGS gauge readings at that moment, orange when rising and blue when falling.
Lightning
Every flash the GOES lightning mapper saw in the 12 minutes before the picture, the newest brightest. From 2018.
Satellite
GOES infrared or water vapor under the radar (choose the band in the menu), over the whole map, land and sea. From 2018.
National radar mosaic
The whole country's radar at that time, under the one radar.
SPC categorical, tornado, wind, hail
The outlooks that were in effect at each picture.
The warnings, watches, reports, lightning and the other overlays cover what is on the screen, over land or sea, as well as the radar’s own area; move the map farther out and they load again for the new area (up to about 30 by 20 degrees at once).
25.4 Hurricanes of the past
The Hurricanes menu of Archive mode opens a storm of the past by its year and basin: every storm the Hurricane Center has a track for, back to 1851, and this season’s storms too. Pick one and the archive opens at its peak, or pick one of its landfalls. The radar is the nearest one that was scanning at that moment, with the storm’s track, the Hurricane Center’s cone and coastal watches and warnings (from 2008), the inland tropical warnings (from 2005), and the satellite of the time where the archive has it.
Before the radar, and the oldest radar
The radar archive begins in 1991. A storm before that plays on a clock of its own, without radar: its track, its strength at each point and the satellite where there is one. The radars from 1991 to 2008 are read as well as the newer ones. A window of the past with no radar scans says so, rather than saying the radar may be offline.
25.5 Texts and soundings
Texts lists the warnings, watches and mesoscale discussions in effect at the time, nearest the radar first, with how far each is. Click one to read its full text.
Sounding draws the observed weather balloon of the day (pick a launch site near the radar) on the map, with its hodograph and the storm numbers.
25.6 A title for the header
The Event title menu names the event on the header (for example Joplin tornado) and puts a line under it. The header shows the date with its year, and the word ARCHIVE in place of LIVE, so nobody takes an old storm for a current one.
25.7 Events: save an archive window and open it again
The Events menu of Archive mode saves what you have set up as an event. Under Save this event give it a Name and, if you like, Notes; the menu says what it keeps: the radar, the date and time, the product, the place the map is looking at, and the window, the overlays and the title as they are now. Press Save this event.
Your events, below it, lists them with their date, time, radar and place, and opens one again with a click, so a storm you replay often (an anniversary, a case you teach from) is never built twice. An event can also be exported as a page that tells what happened.
Events live in Archive mode only; they are not repeated in the Library of the live map (section 18.7).
25.8 3D radar and 3D satellite
The 3D button in the tool rail stands the archive's own scans up on the map, built from every tilt of the radar. Its look is the live map’s 3D settings, and the box button beside it makes 3D of one part (section 25.2).
3D satellite (in Overlays, under Imagery, with Satellite on) stands the cloud tops up at their height. The height is estimated from how cold the top is, so it is a guide, not a measurement; Cloud height stretches it from 1× to 8×. The 3D satellite hides the radar and map under it: turn it off to see them.
25.9 Limits
Radar goes back to 1991, but older files were written differently and some very old scans may not read.
Satellite and lightning start in 2018. The satellite is the eastern GOES, or the western one when the middle of the map is west of about 112° W. A view that reaches past the United States uses the satellite’s full-disk picture, which can take a little longer to load.
Storm reports start in 2004 and damage surveys in 2010. The SPC tornado list ends in September 2025.
The window is at most three days; lightning loads one part (about three hours) at a time, which can take a minute.
Part 5Keep it running
Knowing it is healthy, keys and backups, and staying up to date.
26. Status, keys, backups and updates
Once the broadcast looks right, this chapter is about keeping it running: knowing at a glance whether the data is flowing, keeping your keys and a backup somewhere safe, keeping AtmoDeck up to date, and knowing what to send us if something is wrong.
26.1 Data health
Everything about whether AtmoDeck and its data are working is on the Status & Health page. The Data feeds list shows each source (weather, alerts, discussions, now playing, scanner, SPC outlook, storm reports, alert map) with a green or red dot and the time of the last success; a red dot shows the reason underneath. The Weather source card tells you which weather service is active: if the main service is unreachable, AtmoDeck switches to the National Weather Service as a backup and shows Backup API Active. The page also holds the API status log, the version and updates, the support report, the watchdog and Map Studio’s background work. The status light in the top bar is green when every feed is answering.
Map Studio background work on this page shows what Map Studio does ahead of time so a switch is instant: the nearby radars and the products made ready, the memory the pictures keep, and how much was fetched in the last hour. Choose Memory use there, or Pause background work on a slow line or a small computer (switches then wait for their pictures).
Performance. For a map that lags while you pan, zoom or tilt it, Hide place names while I move the map fades the names, the weather icons and the point values out while your hand moves the map, and back in a moment after; tours, flights and blocks on the air keep theirs. Low quality mode draws the map less often. Test map speed turns the Console’s map at a tilt for a few seconds and reports the graphics card, the map’s size and layers, and the frame times, with each kind of layer switched off in turn, to show where the time goes.
The speed test also names the processor (and says when the computer is on battery), times the program’s own work on each frame and its stalls, says when the window was hidden during the test, and ends with one line on what holds the map back: the processor, a stall, or the graphics card and its driver.
26.2 The as-run log
Status & Health > As-run log keeps what was done to the broadcast and when, on this computer and across restarts (the last 4,000 entries): every change made to the map's settings, each Show set up, each step of the run of show, each layout switched, Back to normal, and Archive mode opened or given a new window. Export it as a CSV, the way the sponsor report is.
26.3 API keys
Keys & Backup > API Keys stores your own credentials on this machine only.
Where the hourly and daily forecasts come from: by default the National Blend of Models (NBM) point guidance from the nearest NBM station (within 100 km): free, no key, no limit, about 40 MB an hour kept on disk. It feeds the widgets' hourly and 5-day forecasts and the slides' forecasts; the conditions of now are the NWS office's own grid (NDFD) whichever is chosen, with the pressure, UV and air quality from the weather source below, which also stands in whenever the NBM cannot answer. Choose The weather source below to go back to the API.
Open-Meteo API Key (optional): leave blank to use the free service; add a paid key for higher limits and commercial use.
NWWS-OI Username and Password (optional): a free login from the National Weather Service for pushed alerts. Leave both blank to skip it.
The Setup tab of the Slides page has its own OpenWeather key box. For where to get each key, what the limits are and what they cost, see the API guide.
26.4 The alert feeds and NWWS
Warnings and watches come from the National Weather Service's public feed, which needs no login. If a refresh fails, the warnings that have not expired stay on the map and the next refresh tries again; a manual retry joins the refresh already on its way instead of starting another.
NWWS-OI (Keys & Backup > API Keys) is optional: with a username and password from the National Weather Service, alerts are also pushed to AtmoDeck the moment they are issued. Leave both blank and nothing connects; the public feed carries on either way, and Status & Health shows NWWS as optional and off rather than as a fault. Changing the login reconnects at once. A missing Open-Meteo or OpenWeather key is not shown as a failure when the free service, or nothing, needs it.
26.5 Backup, restore and factory reset
Keys & Backup > Backup & Restore keeps your setup safe in four ways:
Automatic backups. AtmoDeck keeps copies of your setup by itself, in its own folder outside the browser profile, so a cleared profile or a crash does not lose it. The newest 40 automatic and 20 saved copies are kept, and all of them are listed, by day, each with a Restore button. Back up now makes one at once and Open the folder shows where they are.
Save everything to a file. One file with everything you customized: colors, cities, counties, cameras, logos, settings, Slide Setup, map slides, color tables and keys (not the sound files). Keep it private, because it holds your keys. Use it to move your setup to another computer.
Restore from a file. Pick a file you saved earlier (an older settings file works too), or one of the copies in the backups folder (the .json.gz files), which is where it starts. It replaces your current settings, after keeping a copy of them.
Caches. Shows how much AtmoDeck has downloaded to make the next start quick (radar volumes and scans, national and model pictures, place names, map styles), and Clear all caches frees the space. None of your settings are touched; it only costs the next download.
More detail
On your AtmoDeck account. Check Keep a copy of my setup on my AtmoDeck account (off by itself) and AtmoDeck sends the setup to the account you signed in with, whenever it changed (every 20 minutes at most). Back up now sends it at once.
What is sent is what a backup file holds, without your keys, passwords, logins, the license, or what belongs to that computer alone (the remote, OBS, chat logins, file paths).
The card lists the backups of each computer of your account, up to 6, each with the copy before it. Restore puts one in place the way a backup file is restored: it asks first, keeps a copy of the current settings, and keeps this computer's own keys and logins. The one before restores the earlier copy, and Forget takes a computer's backups off the account.
A new or rebuilt computer gets its setup back by signing in: when the account has a backup from another computer and this one has none, AtmoDeck says so once.
Factory Reset Everything (under Start over) erases the colors, cities, counties, cameras, logos, alert colors, credentials and general settings you customized, and asks you first. Sound files are kept. It cannot be undone, so save a file first.
Tip. Save a file before every big change and keep it somewhere safe. Your settings live on the computer; a copy goes to your AtmoDeck account only if you ask for it (On your AtmoDeck account, above).
26.6 The Team page: sync several computers
The Team page (in the Setup group of the Console) keeps everyone on a team on the same setup, live. It shares everything except keys, passwords, tokens, the license and what belongs to one computer (the output shape, the sound device, file paths): the layouts, colors, looks, alert color presets, all of Map Studio (its tables, bundles, slides, blocks, shows and run of show, and all its other settings), the places, the station, the widgets, the content widgets, the voice, your own forecast numbers, the slides, the teleprompter script, the posting settings, the saved graphics and the uploaded sounds, photos and videos. Each part is kept in step by itself, so two people who change different parts never get in each other’s way.
Map cues, show plans, blocks, map slides, layer sets, looks, layouts and alert color presets are not kept in step: a list kept in step goes over the whole list on the other computer. Share them one at a time through the team's bucket (below). Two computers that must be alike, a main and a backup, can turn on Also keep saved items the same on every computer at the end of What is kept in step. Color tables stay in step, since the map's settings name the table they use.
More detail: The team and its folder, Who can do what, The first time: which computer sends everything, How it keeps in step
The team and its folder
The AtmoDeck team. The people of a team are added by email. AtmoDeck’s server only passes the changes along to the teammates who are on line at that moment and keeps none of them; all it remembers is the team’s name and the email of each person. Each person signs in to AtmoDeck with their account, and accepts the invitation under Your teams. Make a team with Make a team, add people with Add by email (the person is mailed too), take one out with ✕ beside the name, and end the team with End the team. A person who is added can Leave. A team has up to 25 people.
Your AtmoDeck Team folder. There is no folder to choose. When a computer starts using a team, AtmoDeck makes a folder for it by itself, Documents > AtmoDeck Team > the team’s name. It holds the whole setup (every setting, and the uploaded sounds, photos and videos), and that folder is what is kept in step with the team through the server. Open the folder on the Sync page shows it. Do not edit it by hand.
Who can do what
Every person on a team is an owner (the one who made it: adds and takes out people, sets roles and ends the team), an editor (the default: their changes go to everyone) or view only. Choose the role beside the email when adding a person, or change it later with the small menu beside their name; it applies at once, even if they are on line. A view only computer receives the team’s whole setup and keeps it in step, but never sends anything, and a change made on it is put back, so an intern can watch the on-air setup without being able to change it. The server refuses what a view only computer tries to send, so it does not depend on the program being honest.
The first time: which computer sends everything
The first time a computer syncs, nothing moves until you say which way. This computer sends everything makes it the one the team uses (what is empty on it is left as the team has it). Take the team’s setup makes it receive everything the team has, after a backup of its own setup. After that the computer keeps in step by itself.
How it keeps in step
Live looks every 3 seconds. A change goes out a few seconds after the person stops, what arrives is put on screen at once, and when two computers changed the same part the newer change wins (the other is in the backup).
Review is for a person who wants to look before anything goes to the team: the team’s changes still come in live, but your own changes wait on your computer. A box titled Your changes, not sent yet lists each part that differs from the team’s with a short account of what is different (for example “1 added, 2 changed”). Send my changes to the team sends them all, Send this one sends one part, and Drop mine puts the team’s version back on your computer.
Careful looks every 20 seconds and asks when a part changed on both computers. Only when I press Sync now does nothing by itself.
Pause syncing stops it for 30 minutes, an hour, 4 hours or until you resume it (also in Ctrl+K: Pause syncing with the team). While it is paused nothing is sent and nothing is put on this computer; resuming catches up.
Team chat. When this computer is in step with a team, the Desk notes card on the Dashboard becomes a live chat: a line you type goes at once to everyone of the team who is on line, with their name and a colored avatar, and theirs come in the same way (the bell tells you when the Dashboard is not what you are looking at). The Notes button on the card goes back to the desk notes. The server only passes a line along and keeps none; the lines are kept on each computer with the desk notes, and a computer that was off line does not get the lines it missed. People who are view only may chat.
Who changed what lately lists what was sent, received or undone, and the name of the computer it came from. Each change taken from the team has an Undo that puts back what your computer had before (the last ten are kept); the undone change then goes to the team like any other change of yours, or waits under Review.
Before the Console takes anything a backup of the setup is made (it is in Backup & Restore). Deleting a sound or a photo on one computer does not delete it on the others.
The uploaded sounds, music and photos of every computer of the team are put together, so each computer ends up with all of them; a large file takes a while to arrive, and the Sync page says how many are still coming. A file over 100 MB cannot go through the team’s server: the Sync page says so, and you copy it to the other computer yourself.
The webcams (Content > Webcams) are a part of their own. The webcams of every computer of the team are put together by their links, so a camera added on one computer shows on the others; the cameras AtmoDeck starts with give way to the ones a teammate added. A team keeps up to 100 webcams.
With saved items kept the same on every computer, the blocks, show plans, map cues, map slides and layer sets of the team's computers are put together item by item, so a teammate's list never takes the place of yours. A block deleted on one computer comes back while another still has it: delete it on both.
Syncing never takes a block away: the team's blocks are added to the ones on your computer, whatever you choose, Use the team's too. Map Studio keeps up to 300 blocks.
Every line of the Sync log (Who changed what lately) has an Undo button: a change that came, one you sent, and an Undo itself. Undo puts back what the parts were before that change, the pages' own settings too, and the team gets it. The last 40 changes are kept; the automatic backups under Backup go further back. Sounds and photos that came stay: delete one under Content.
The team's bucket
Under Your teams is the team's bucket: what the people of the team you use put in it for each other, kept on the AtmoDeck server until someone takes it. Nothing in the bucket comes to a computer by itself, so it works the same whether syncing is on or off, and joining, leaving or ending a team never changes anyone's setup.
The bucket has a folder for each kind of item, and each folder says in a line what that kind is:
Folder
What it holds
Map cues
A segment set up in one click: its layers, viewpoint group, a map slide and a layout.
Show plans
The run of show on the Show page: blocks and other steps in order, with their times.
Blocks
The map as a timed step of a show plan: a still for some seconds, or a loop.
Slides
A slide you made in Slides › Builder: its template, name, city and lines. A step of a show plan, or a slide of the slideshow.
Map slides
The map as a slide of the slideshow, also cut to by hotkey. Your slides of Slides › Builder are in Slides, not here.
Layer sets
Several map products turned on together.
Alert color presets
The colors of the warnings and watches, and which ones are hidden, switched together on air.
Looks, Layouts, Color tables, Colors
The same as on their own pages. The bucket keeps one set of Colors per team.
Each item is a tile with a picture (a block brings its own; the others are drawn from what they are), its kind, who put it in and when. Put in lists yours of that kind: tick them, give a team folder if you like (Mornings, Severe...) and press Put in the bucket. A map cue goes in with its map slide and layout, and a show plan with its blocks and its slides of Slides › Builder, so they work on the next computer. Putting in one the bucket already has updates it there.
Take adds the item, and what it needs, to your setup. One you already have with the same name tag is replaced by the bucket's (the tile says On this computer), so a show plan still finds its blocks. A backup of your setup is made first (Backup & Restore). The ⋯ on a tile renames it, moves it to another team folder or takes it out of the bucket; taking it out does not remove it from computers that took it. People who are view only on the team can look and take, but not put in.
Each team has room for 512 MB; the bucket shows how much is used.
Saved map styles and saved views from two computers are combined, not chosen between: when a teammate saves a style and you have styles of your own, both lists become one, and the newer edit of the same style wins. Use the team’s still takes the team’s list as it is.
26.7 Error reports
Error reports (a card on Status & Health) lets you tell us when AtmoDeck itself goes wrong, so a problem can be fixed before anyone has to write to us. It is off until you switch it on, and nothing is collected while it is off.
What is sent: a short list of problems, each with where it happened (the main program, the Console or the Output), the message, a few lines of detail, how many times it happened and when, plus the AtmoDeck version and your Windows version. The same problem happening a thousand times is one line with a count.
What is never sent: your settings, places, weather, files, pictures or keys. Before anything is kept, file paths with your user name, email addresses, keys, tokens and long codes are taken out, and the server cleans it a second time.
See it first:Show what would be sent displays the exact report as it would leave this computer, and Send now sends it at once. Otherwise it goes by itself every ten minutes while there is something to report. Switching the card off throws away what was waiting.
Crashes. With the card on, a helper that stopped (the graphics process, a radar decoder) and a last run that did not end by itself (a crash, a power cut or a forced stop) are in the report like any other problem, with what stopped and why. If AtmoDeck itself crashes, Windows' crash dump is kept on this computer only and is never sent.
26.8 Hidden errors
Status & Health has a Hidden errors list. Much of the drawing catches its own errors so that one bad moment cannot stop the map; this list counts what was caught, in the Console window and in the Output window, each kind once with how often it happened and when.
A few entries while the map changes style are normal. One whose count keeps climbing, shown in red, is a fault worth reporting (section 26.7). Clear this window's list empties the Console's list.
26.9 Updates, and what is new
Updates. The installed app checks for a new version shortly after it starts and every few hours, downloads it quietly, and never restarts by itself. Updates are delivered through AtmoDeck's license server, so they need an active license: if the app says updates need an active license, open AtmoDeck while online once so it can renew. When one is ready a banner appears in the console; click Restart & install (twice, so you cannot do it by accident on air), or it installs the next time you start AtmoDeck. Status & Health shows your version and a Check for updates button.
What's new and getting started. After an update, a one-time box lists what changed (you can reopen it with What's new in Status & Health > Version & updates). Until the basics are done, a short Getting started checklist sits at the top of On Air: set your area, add a logo and a camera, turn on or move a widget, save a layout. Its items tick themselves, and you can hide it.
If AtmoDeck says its updater is missing
AtmoDeck’s updater is a small program, Update.exe, in the folder AtmoDeck is installed in. A security program sometimes takes it away as a precaution, and then updates can’t be checked: Version & updates says the updater is missing. Restore it from the security program’s quarantine (and allow it there), or run the AtmoDeck setup from the download page again. Your settings and saved work are kept either way.
26.10 Free trial, referrals and your account
Free trial. New subscriptions start with a 7-day free trial. While it runs, Status & Health shows how many days are left. You are charged when it ends unless you cancel first on the account page.
Referral link. On the account page, sign in with your subscription email or use the legacy license-key tools, then choose Get my referral link. When someone starts a trial through your link it is counted there. Any rewards are announced separately and may change.
26.11 The watchdog and getting support
Watchdog. In Status & Health, the Watchdog restarts the output by itself if it freezes or crashes (default: no sign of life for 90 seconds), and, if its weather or alert data is more than 45 minutes old, first asks it to refresh and then restarts it if that does not help. It shows a Windows notification and a banner when it acts and keeps a list of recent events. It restarts at most 3 times an hour, and never for stale data while the PC is offline. Use Test it to freeze the output on purpose and watch it recover.
The watchdog can also work through your team. On a computer in a team (the Team page, section 26.6), the watchdog card has two more settings:
Tell my team in the team chat when it acts: each restart or refresh is said in the team's chat (Watchdog on STUDIO-PC: ...), so a teammate at home sees it.
Back up the output of a computer of the team: this computer becomes its standby. When that computer leaves the team's connection (off, crashed or without internet) for longer than the freeze time, this computer shows its own output in its place and says so in the chat, and says again when the other is back. Handing back is yours to do.
Support. If something is not working, open Status & Health > Support and click Copy diagnostics (or Save as a file), then paste it into your email to us. The report lists your version, the health of your data services and recent errors. It never includes your license key, API keys or passwords.
26.12 When something is not right
Start from what you see, then go to the section that explains it.
What you see
Where to look
The status light in the top bar is not green
Status & Health lists every data feed with a red dot and the reason under it (section 26.1).
The weather says Backup API Active
The main weather service is unreachable and AtmoDeck is using the National Weather Service (section 26.1).
Is On output switched on (section 18.1)? Look at the radar light in Status & Health and the loading box at the foot of Active layers, which has Stop and Restart (section 18.2). The national radar needs a graphics card with WebGL 2.
The Console, or a green border, shows in OBS
Capture the window titled AtmoDeck Output and crop 10 pixels on every side (section 4.2).
By default every post waits for your click under Waiting for your click (section 12.1). Check the limits and the alert types chosen (section 12.3), and use Send a test on the destination (section 12.2).
Next step. The keys for Next, Back, Hold and Break in work anywhere (Ctrl + Alt + N, B, H and X to begin with) and can be changed on the Show page (section 13.5).
Select the widget behind the one in front (section 8.2).
Right-click
Map Studio, on the map
The menu for that spot: radar, sounding, mesoanalysis and forecast slides (section 18.13).
Ctrl + click
Map Studio, on a warning
Add a box beside the ones showing: a warning with its people, hospitals and schools, a gauge, a marker (section 18.16; B makes every box compact or detailed) (section 18.14).
1 to 9, 0, -, =
Map Studio
The first twelve quick buttons.
The Map Studio keys
Map Studio
Play, step, tilt, views, scenes, tools and layers: 47 keys in all, listed on the Keybinds page (section 16.5).
Esc
The Output, while a slide or sounding is up
Take it away.
27.2 Limits at a glance
Item
Limit
Counties monitored
Up to 260 (Canada: up to 200 forecast zones)
Cities
Practical limit about 35 to 40 on the free weather tier
Webcams
Up to 30
Forecast offices used
Up to 6, chosen automatically
Saved layouts
Up to 20
Slideshow groups
Up to 8, each widget in one group
Coming Up cities
1 to 6
Custom Data widgets
3
World clock cities
Up to 6
Storm-chaser radius
15 to 100 miles
Radar loop
2 to 10 frames, 5 minutes apart
Custom ticker feeds
Up to 10
Hourly widget
1 to 12 hours, or 1 to 6 days
5-Day widget
1 to 6 days, or 1 to 8 hours
Active Alerts widget
1 to 12 rows
Text cards
Up to 12
Closings entries
Up to 60
Sponsor logos
Up to 20
River and lake gauges
Up to 12
Marine stations
Up to 8
Lower third titles
Up to 20, each staying 2 to 120 seconds
Looks
Up to 20
Weather icon pictures
One for each of 19 kinds of weather, up to 3 MB each
Map data layers
Up to 4, over the radar (one of them can be a mesoanalysis map)